


NAIOP, the Commercial Real Estate Development Association, recently released its annual study “Economic Impacts of Commercial Real Estate” in which it details the development, construction, and ongoing operations of new commercial real estate in the U.S.
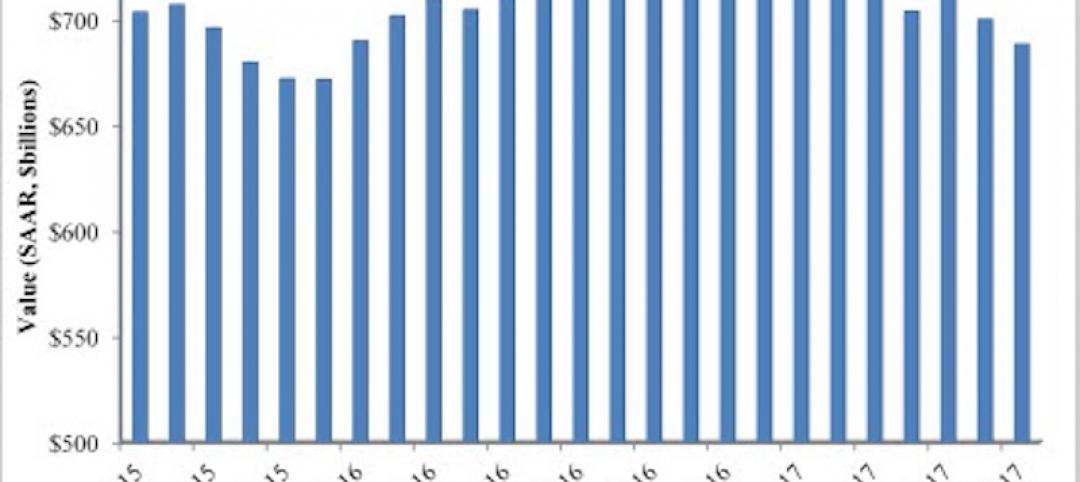
The study shows office, industrial, warehouse, and retail real estate development supported 6.25 million American jobs and contributed $861 billion to U.S. GDP in 2016. Between 2011 and October 2016, construction spending increased 48.7% and was a key factor in the economy’s growth in 2016. For the year ending in October 2016, total construction spending was up 3.4%.
Office and Warehouse spending increased by 28.7% and 12.7% respectively from 2015. Retail spending decreased 7 percent from gains of 8.2% in 2015. Industrial spending decreased significantly for the second straight year, down 29.9% from 2015.
Of the top 10 states by construction value (office, industrial, warehouse, and retail), only three (New York, Texas, and Florida) remained in the same position as 2015. New York was once again first on the list with $24.8 billion in direct spending and $46.05 billion in total output. Texas wasn’t far behind with $18.5 billion in direct spending and $44.3 billion in total output. Florida once again took the fifth position on the list.

To view the full report, click here.
Related Stories

Multifamily Housing | Sep 15, 2017
Hurricane Harvey damaged fewer apartments in greater Houston than estimated
As of Sept. 14, 166 properties reported damage to 8,956 units, about 1.4% of the total supply of apartments, according to ApartmentData.com.
Hotel Facilities | Sep 6, 2017
Marriott has the largest construction pipeline of any franchise company in the U.S.
Marriott has the most rooms currently under construction with 482 Projects/67,434 Rooms.
Market Data | Sep 5, 2017
Nonresidential construction declines again, public and private sector down in July
Weakness in spending was widespread.

Market Data | Aug 29, 2017
Hidden opportunities emerge from construction industry challenges
JLL’s latest construction report shows stability ahead with tech and innovation leading the way.

Market Data | Aug 28, 2017
U.S. hotel construction pipeline is up 7% year-over-year
For the economy, the rate of growth may be low but it’s running on all cylinders.
Market Data | Aug 23, 2017
Architecture Billings Index growth moderates
“The July figures show the continuation of healthy trends in the construction sector of our economy,” said AIA Chief Economist, Kermit Baker.

Architects | Aug 21, 2017
AIA: Architectural salaries exceed gains in the broader economy
AIA’s latest compensation report finds average compensation for staff positions up 2.8% from early 2015.
Market Data | Aug 20, 2017
Some suburban office markets are holding their own against corporate exodus to cities
An analysis of mortgage-backed loans suggests that demand remains relatively steady.
Market Data | Aug 17, 2017
Marcum Commercial Construction Index reports second quarter spending increase in commercial and office construction
Spending in all 12 of the remaining nonresidential construction subsectors retreated on both an annualized and monthly basis.

Industry Research | Aug 11, 2017
NCARB releases latest data on architectural education, licensure, and diversity
On average, becoming an architect takes 12.5 years—from the time a student enrolls in school to the moment they receive a license.


