


NAIOP, the Commercial Real Estate Development Association, recently released its annual study “Economic Impacts of Commercial Real Estate” in which it details the development, construction, and ongoing operations of new commercial real estate in the U.S.
The study shows office, industrial, warehouse, and retail real estate development supported 6.25 million American jobs and contributed $861 billion to U.S. GDP in 2016. Between 2011 and October 2016, construction spending increased 48.7% and was a key factor in the economy’s growth in 2016. For the year ending in October 2016, total construction spending was up 3.4%.
Office and Warehouse spending increased by 28.7% and 12.7% respectively from 2015. Retail spending decreased 7 percent from gains of 8.2% in 2015. Industrial spending decreased significantly for the second straight year, down 29.9% from 2015.
Of the top 10 states by construction value (office, industrial, warehouse, and retail), only three (New York, Texas, and Florida) remained in the same position as 2015. New York was once again first on the list with $24.8 billion in direct spending and $46.05 billion in total output. Texas wasn’t far behind with $18.5 billion in direct spending and $44.3 billion in total output. Florida once again took the fifth position on the list.

To view the full report, click here.
Related Stories
Market Data | Nov 27, 2017
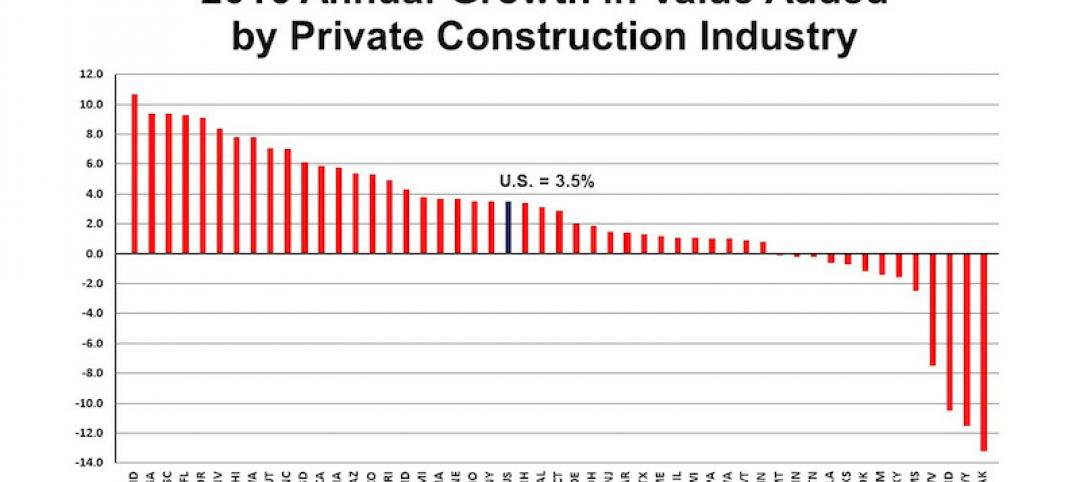
Construction's contribution to U.S. economy highest in seven years
Thirty-seven states benefited from the rise in construction activity in their state, while 13 states experienced a reduction in activity.
Market Data | Nov 15, 2017
Architecture Billings bounce back
Business conditions remain uneven across regions.
Market Data | Nov 14, 2017
U.S. construction starts had three consecutive quarters of positive growth in 2017
ConstructConnect’s quarterly report shows the most significant annual growth in the civil engineering and residential sectors.

Market Data | Nov 3, 2017
New construction starts in 2018 to increase 3% to $765 billion: Dodge report
Dodge Outlook Report predicts deceleration but still growth, reflecting a mixed pattern by project type.
Market Data | Nov 2, 2017
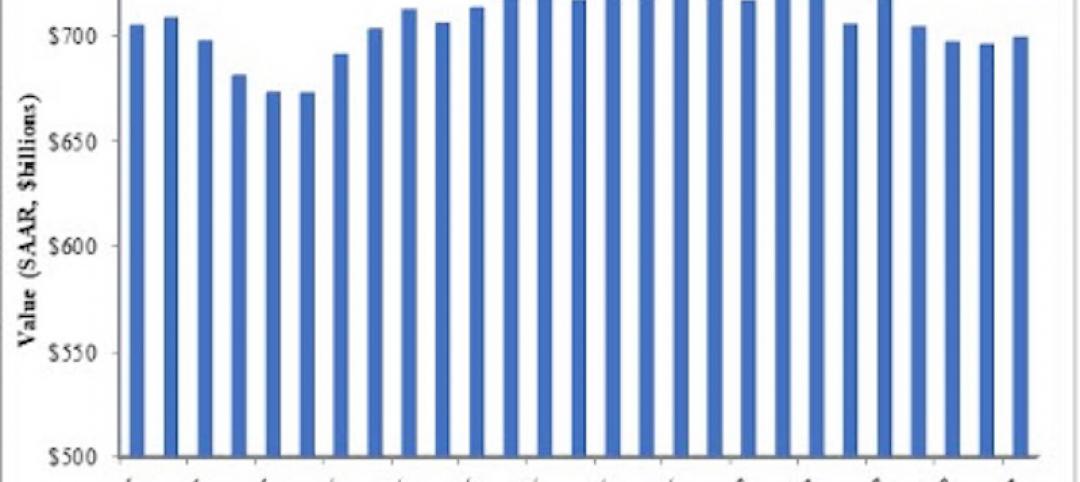
Construction spending up in September; Down on a YOY basis
Nonresidential construction spending is down 2.9% on a year-over-year basis.

Market Data | Oct 19, 2017
Architecture Billings Index backslides slightly
Business conditions easing in the West.

Industry Research | Oct 3, 2017
Nonresidential construction spending stabilizes in August
Spending on nonresidential construction services is still down on a YOY basis.

Market Data | Sep 21, 2017
Architecture Billings Index continues growth streak
Design services remain in high demand across all regions and in all major sectors.

Market Data | Sep 21, 2017
How brand research delivers competitive advantage
Brand research is a process that firms can use to measure their reputation and visibility in the marketplace.

Contractors | Sep 19, 2017
Commercial Construction Index finds high optimism in U.S. commercial construction industry
Hurricane recovery efforts expected to heighten concerns about labor scarcities in the south, where two-thirds of contractors already face worker shortages.


