


The New York metropolitan area is on track to generate $1.797 trillion in gross domestic product in 2019, which would rank first among all metros in the United States by a wide margin. New York is projected to hold onto that ranking through at least 2035, when its GDP could reach $2.511 trillion, according to the annual Global Cities report published by Oxford Economics, a London-based independent global advisory firm.
The change in New York’s GDP would represent 2% annual growth, driven by a finance and business services sector that is the largest of any major world city. However, Oxford Economics projects that San Jose, Calif., with its high-tech and entrepreneurial ecosystem, will lead all American metros in annual GDP growth through 2035, at 3%, followed by Portland, Ore., and Austin, Texas (2.6%), and Seattle, Charlotte, N.C., Nashville, and San Francisco (2.4%).
Oxford believes that San Jose’s greatest asset is the “scale and diversity of its technical workforce.” This metro’s annual GDP growth averaged 7.4% during the years 2013-17. In Portland, where manufacturing accounts for roughly 40% of its annual growth, high-tech production is expected to sustain its robust economy.
Nashville, whose population has roughly doubled in the last 40 years, was recently chosen by Amazon for a new operations center that will employ 5,000 people. Apple plans to invest $1 billion in Austin, where the tech giant could eventually employ 15,000 people.
Behind New York, the cities that rank highest for projected GDP for 2019 and 2035 are Tokyo, Los Angeles, and London. L.A.’s GDP is expected to hit $1.093 trillion next year, and expand by 41.4% to $1.545 trillion in 2035. Oxford expressed some surprise about L.A.’s likely position, given that its financial and business services sector only accounts for 39% of its economy. But L.A.’s west-coast location and economic diversity are surely benefits.
Oxford also considers urban economies in terms of industrial output. On that score, two Texas cities, Houston and Dallas, are being driven by their low-tax, low-regulation model, and relatively abundant land, to achieve strength in moderately high-value manufacturing segments. (Dallas and Houston are ranked 4th and 7th, respectively, in projected 2019 and 2035 GDP.)
Conversely, Oxford wonders about Chicago’s prospects. The Windy City ranks third in projected GDP for both years tracked, but its financial and business services sector, relative to the city’s size, is actually smaller than Boston’s, San Francisco’s, and Washington D.C.’s.
“Fundamentally, it is tough being a Midwest city such as Chicago: regional growth is not so strong; many corporate headquarters and production facilities have moved south in search of lower taxes, laxer regulations, cheaper costs and more sun; and the start-up and tech scenes are elsewhere,” writes Oxford. On the other hand, Oxford points out that naysayers who wrote off Chicago in past years have been proven wrong because Chicago continues to offer “acceptable compromises,” such as affordability, livability, and opportunity, that keep it competitive nationally and globally.
While a large share of America’s GDP is clustered within its 10 largest cities, Oxford Economics notes that around two-thirds of U.S. economic output still comes from medium- and small-sized cities and towns. Of the top 20 metros by forecasted GDP growth through 2022, nine have fewer than 500,000 people. Many of these cities are located in the Southwest and Mountain regions, and benefit from an improved energy sector, immigration (although that remains an uncertainty, given the current political climate), and an evolving economic base.
Fastest growing U.S. cities 2019-35
Rank City avg. annual % growth
1 San Jose 3.0
2 Portland 2.6
3 Austin 2.6
4 Seattle 2.4
5 Charlotte 2.4
6 Nashville 2.4
7 San Francisco 2.4
8 Orlando 2.3
9 Dallas 2.3
10 Salt Lake 2.3
Top U.S. cities by size of economy
Rank 2035 Rank 2019 City GDP GDP % chg.
$B 2019 $B 2035
1 1 New York 1,797 2,511 39.7
2 2 Los Angeles 1,093 1,545 41.4
3 3 Chicago 713 957 34.3
4 4 Dallas 573 839 46.4
5 6 San Francisco 532 796 49.6
6 5 Washington 559 779 39.3
7 7 Houston 529 758 43.2
8 9 Boston 461 656 42.5
9 8 Philadelphia 467 650 39.4
10 10 Atlanta 402 575 42.9
Source: Oxford Economics
Related Stories
High-rise Construction | Jan 23, 2017
Growth spurt: A record-breaking 128 buildings of 200 meters or taller were completed in 2016
This marks the third consecutive record-breaking year for building completions over 200 meters.

Market Data | Jan 18, 2017
Fraud and risk incidents on the rise for construction, engineering, and infrastructure businesses
Seven of the 10 executives in the sector surveyed in the report said their company fell victim to fraud in the past year.

Market Data | Jan 18, 2017
Architecture Billings Index ends year on positive note
Architecture firms close 2016 with the strongest performance of the year.

Market Data | Jan 12, 2017
73% of construction firms plan to expand their payrolls in 2017
However, many firms remain worried about the availability of qualified workers.

Market Data | Jan 9, 2017
Trump market impact prompts surge in optimism for U.S. engineering firm leaders
The boost in firm leader optimism extends across almost the entire engineering marketplace.
Market Data | Jan 5, 2017
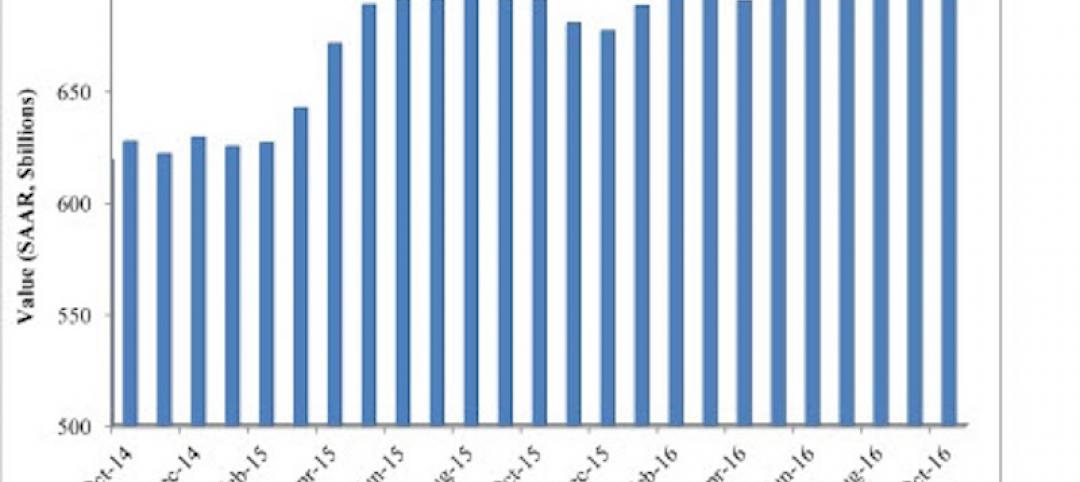
Nonresidential spending thrives in strong November spending report
Many construction firms have reported that they remain busy but have become concerned that work could dry up in certain markets in 2017 or 2018, says Anirban Basu, ABC Chief Economist.

Market Data | Dec 21, 2016
Architecture Billings Index up slightly in November
New design contracts also return to positive levels, signifying future growth in construction activity.
Market Data | Dec 21, 2016
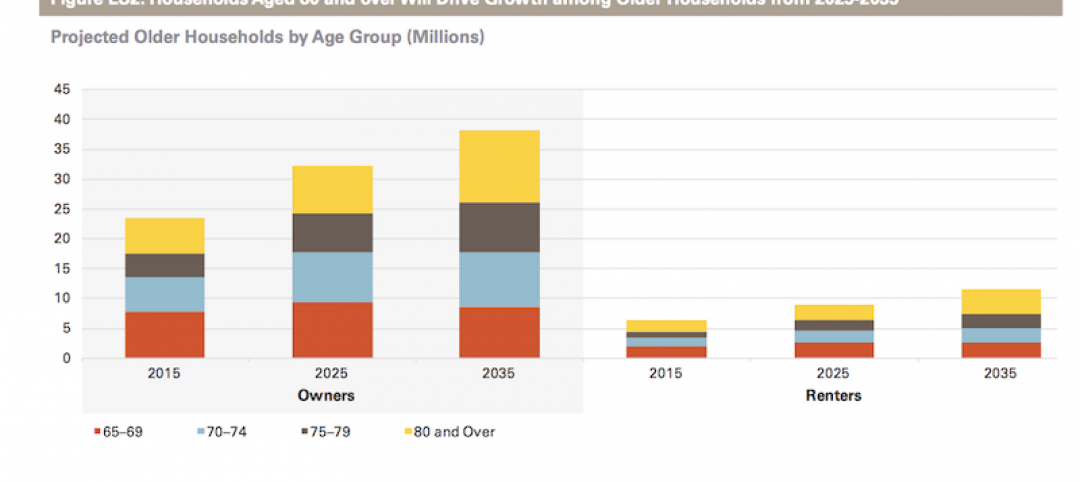
Will housing adjust to an aging population?
New Joint Center report projects 66% increase in senior heads of households by 2035.
Market Data | Dec 13, 2016
ABC predicts modest growth for 2017 nonresidential construction sector; warns of vulnerability for contractor
“The U.S. economy continues to expand amid a weak global economy and, despite risks to the construction industry, nonresidential spending should expand 3.5 percent in 2017,” says ABC Chief Economist Anirban Basu.
Market Data | Dec 2, 2016
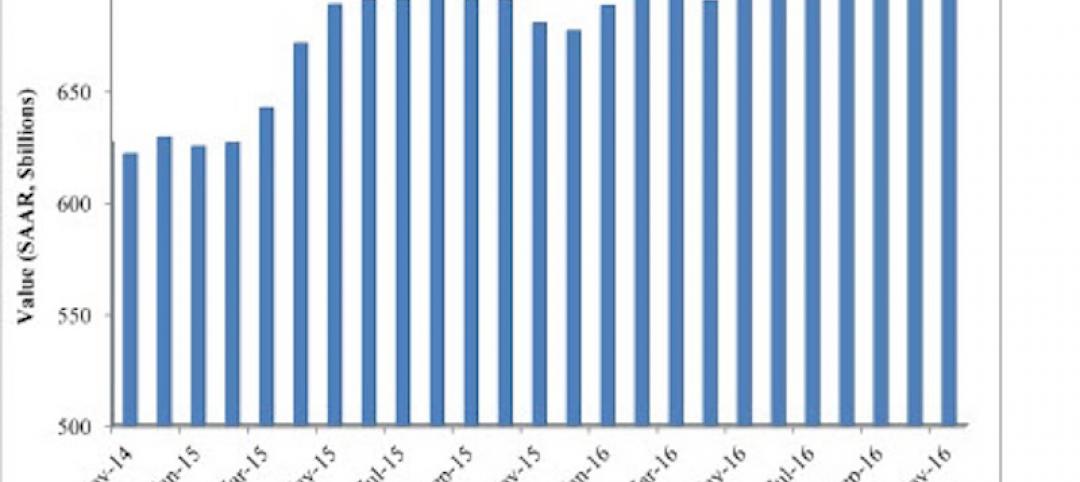
Nonresidential construction spending gains momentum
Nonresidential spending is now 2.6 percent higher than at the same time one year ago.


