

According to Lodging Econometrics’ (LE’s) Construction Pipeline Trend Report for the United States, the total U.S. construction pipeline stands at 5,216 projects/650,222 rooms. These are year-end 2020 results, and are down only incrementally, as the United States grappled with the ongoing coronavirus pandemic, an election, civil unrest, and the large and rapid partisan shift taking place. However, the announcement of various vaccine developments and distribution was undeniably good news for the general public, businesses, hotel development and the lodging industry as a whole, especially going forward. The industry has found optimism in the fact that as the vaccine rolls out travel demand will increase rather quickly, resulting in increased confidence in hotel development activity.
At the end of Q4 ‘20, projects currently under construction stand at 1,487 projects/199,700 rooms. Of the 1,487 projects under construction, 24% of these projects in the pipeline belong to extended-stay brands, a segment of the industry that developers have become increasingly interested in over the last few years. Projects under construction continue to move towards opening. Through year-end 2020, the U.S. opened 833 projects accounting for 97,203 rooms, bringing the U.S. supply of open & operating hotels to 58,569 hotels/5,557,119 rooms. Additionally, of the 833 projects opened in 2020, an impressive 29% of those projects belong to extended-stay brands.
LE is forecasting another 929 projects/107,407 rooms to open by the end of 2021. If all of these projects come to fruition it will represent a 1.9% increase in new hotel supply. For 2022, LE is forecasting 1,031 projects/116,749 rooms to open.
Projects scheduled to start construction in the next 12 months total 2,015 projects/234,703 rooms, down 12% by projects and 11% by rooms YOY. Projects in the early planning stage stand at 1,714 projects/215,819 rooms, a cyclical high in the number of rooms, and up slightly YOY.
It is also worth noting that renovations and brand conversions are becoming more prevalent. At the end of Q4 ‘20, there were a total 1,308 projects/210,124 rooms under renovation or conversion in the U.S. The number of projects and rooms has grown consistently over the last three quarters of 2020.
Related Stories

Market Data | Jun 3, 2019
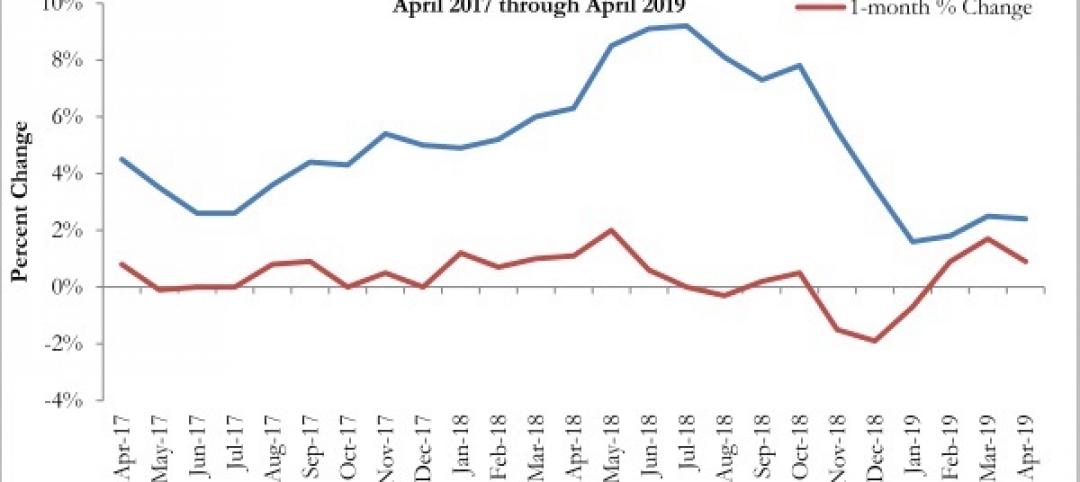
Nonresidential construction spending up 6.4% year over year in April
Among the 16 sectors tracked by the U.S. Census Bureau, nine experienced an increase in monthly spending, led by water supply and highway and street.

Market Data | Jun 3, 2019
4.1% annual growth in office asking rents above five-year compound annual growth rate
Market has experienced no change in office vacancy rates in three quarters.

Market Data | May 30, 2019
Construction employment increases in 250 out of 358 metros from April 2018 to April 2019
Demand for work is outpacing the supply of workers.
Market Data | May 24, 2019
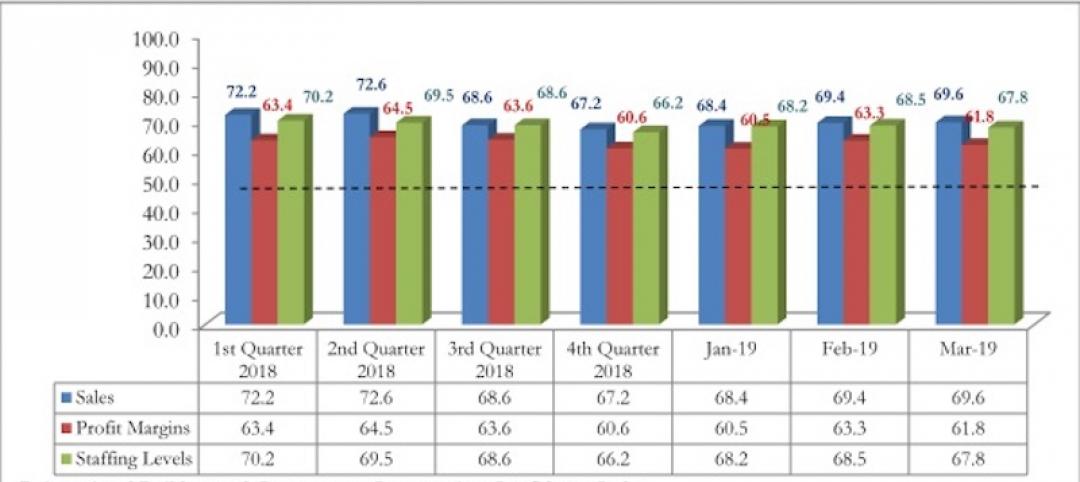
Construction contractors confidence remains high in March
More than 70% of contractors expect to increase staffing levels over the next six months.
Market Data | May 22, 2019
Slight rebound for architecture billings in April
AIA’s ABI score for April showed a small increase in design services at 50.5 in April.
Market Data | May 9, 2019
The U.S. hotel construction pipeline continues to grow in the first quarter as the economy shows surprising strength
Projects currently under construction stand at 1,709 projects/227,924 rooms.
Market Data | May 9, 2019
Construction input prices continue to rise
Nonresidential input prices rose 0.9% compared to March and are up 2.8% on an annual basis.
Market Data | May 7, 2019
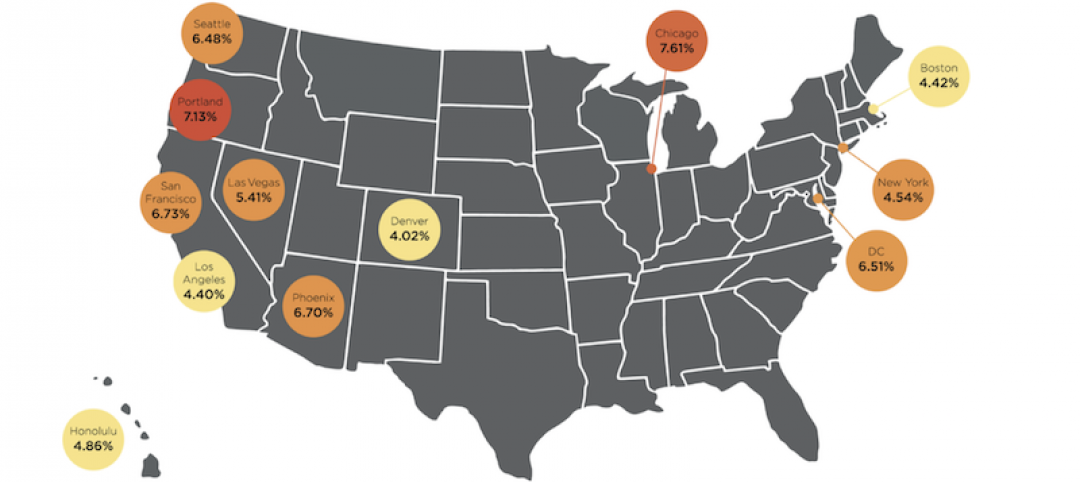
Construction costs in major metros continued to climb last year
Latest Rider Levett Bucknall report estimates rise at more than double the rate of 2018 Growth Domestic Product.
Market Data | Apr 29, 2019
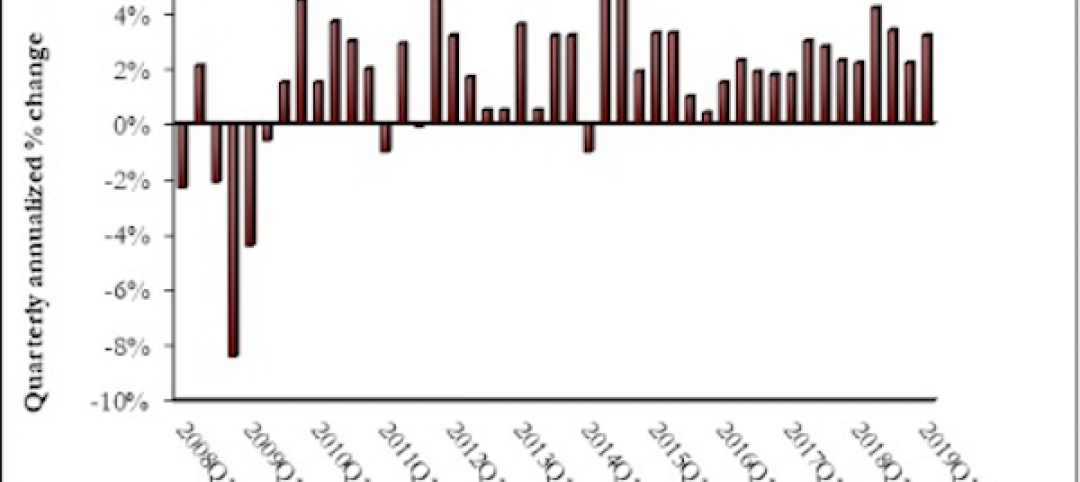
U.S. economic growth crosses 3% threshold to begin the year
Growth was fueled by myriad factors, including personal consumption expenditures, private inventory investment, surprisingly rapid growth in exports, state and local government spending and intellectual property.

Market Data | Apr 18, 2019
ABC report: 'Confidence seems to be making a comeback in America'
The Construction Confidence Index remained strong in February, according to the Associated Builders and Contractors.


