


According to Lodging Econometrics’ (LE’s) Construction Pipeline Trend Report for the United States, the total U.S. construction pipeline stands at 5,216 projects/650,222 rooms. These are year-end 2020 results, and are down only incrementally, as the United States grappled with the ongoing coronavirus pandemic, an election, civil unrest, and the large and rapid partisan shift taking place. However, the announcement of various vaccine developments and distribution was undeniably good news for the general public, businesses, hotel development and the lodging industry as a whole, especially going forward. The industry has found optimism in the fact that as the vaccine rolls out travel demand will increase rather quickly, resulting in increased confidence in hotel development activity.
At the end of Q4 ‘20, projects currently under construction stand at 1,487 projects/199,700 rooms. Of the 1,487 projects under construction, 24% of these projects in the pipeline belong to extended-stay brands, a segment of the industry that developers have become increasingly interested in over the last few years. Projects under construction continue to move towards opening. Through year-end 2020, the U.S. opened 833 projects accounting for 97,203 rooms, bringing the U.S. supply of open & operating hotels to 58,569 hotels/5,557,119 rooms. Additionally, of the 833 projects opened in 2020, an impressive 29% of those projects belong to extended-stay brands.
LE is forecasting another 929 projects/107,407 rooms to open by the end of 2021. If all of these projects come to fruition it will represent a 1.9% increase in new hotel supply. For 2022, LE is forecasting 1,031 projects/116,749 rooms to open.
Projects scheduled to start construction in the next 12 months total 2,015 projects/234,703 rooms, down 12% by projects and 11% by rooms YOY. Projects in the early planning stage stand at 1,714 projects/215,819 rooms, a cyclical high in the number of rooms, and up slightly YOY.
It is also worth noting that renovations and brand conversions are becoming more prevalent. At the end of Q4 ‘20, there were a total 1,308 projects/210,124 rooms under renovation or conversion in the U.S. The number of projects and rooms has grown consistently over the last three quarters of 2020.
Related Stories
Market Data | Jul 18, 2019
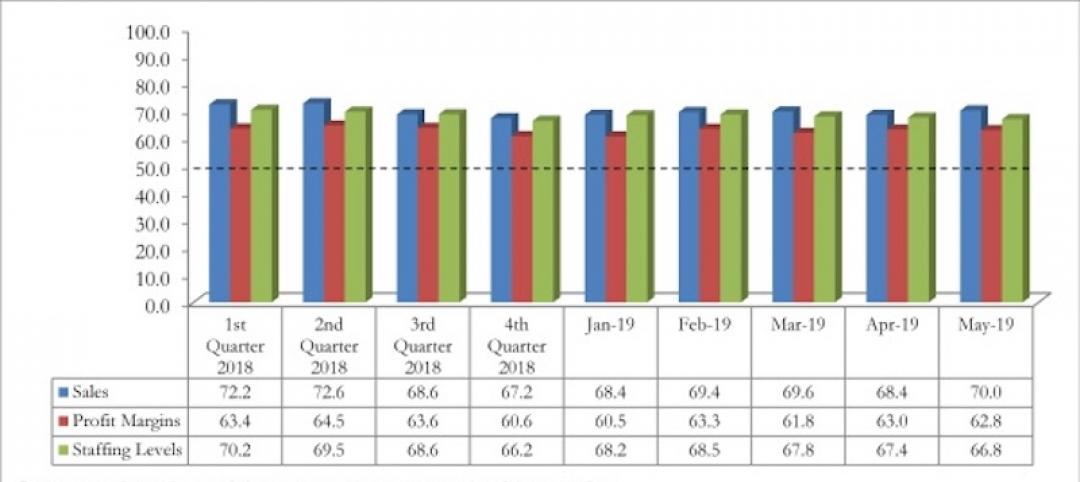
Construction contractors remain confident as summer begins
Contractors were slightly less upbeat regarding profit margins and staffing levels compared to April.

Market Data | Jul 17, 2019
Design services demand stalled in June
Project inquiry gains hit a 10-year low.
Market Data | Jul 16, 2019
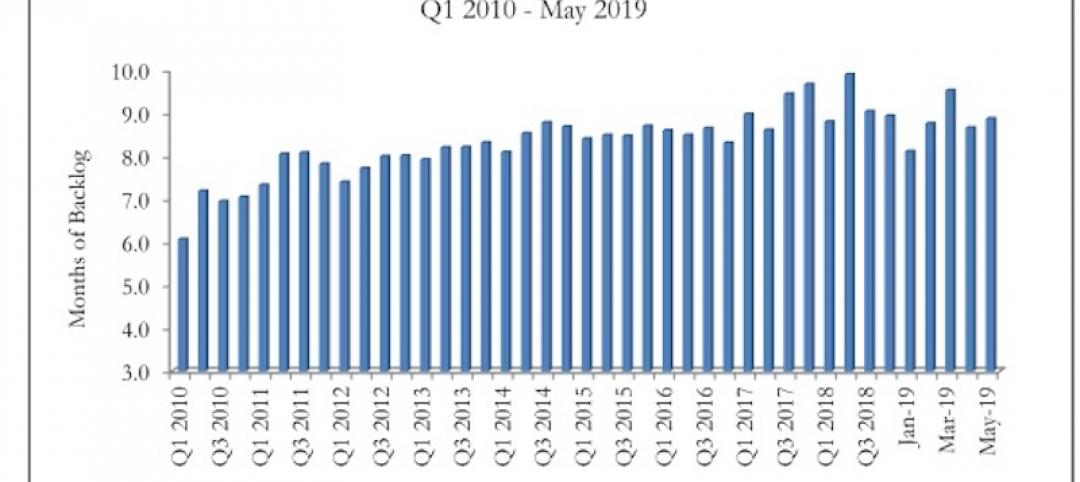
ABC’s Construction Backlog Indicator increases modestly in May
The Construction Backlog Indicator expanded to 8.9 months in May 2019.

K-12 Schools | Jul 15, 2019
Summer assignments: 2019 K-12 school construction costs
Using RSMeans data from Gordian, here are the most recent costs per square foot for K-12 school buildings in 10 cities across the U.S.
Market Data | Jul 12, 2019
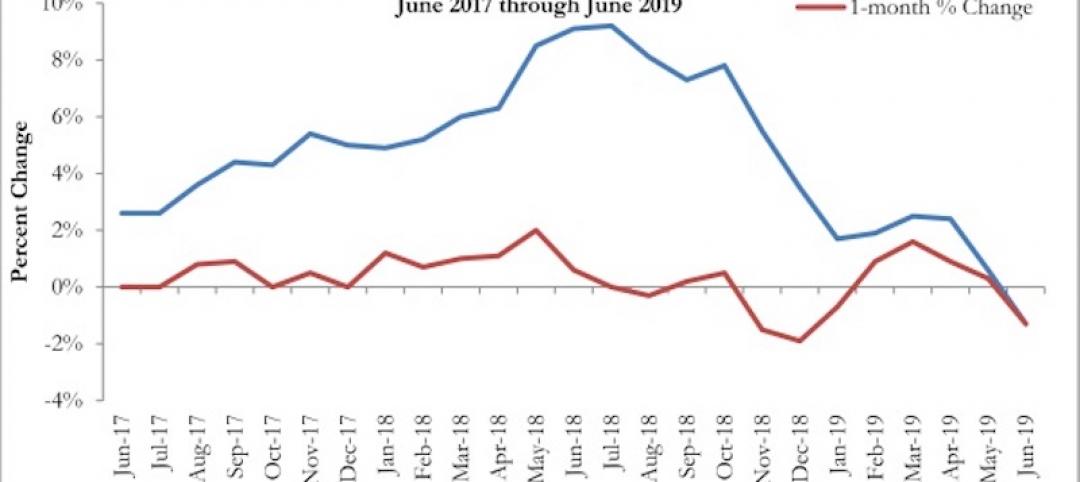
Construction input prices plummet in June
This is the first time in nearly three years that input prices have fallen on a year-over-year basis.
Market Data | Jul 1, 2019
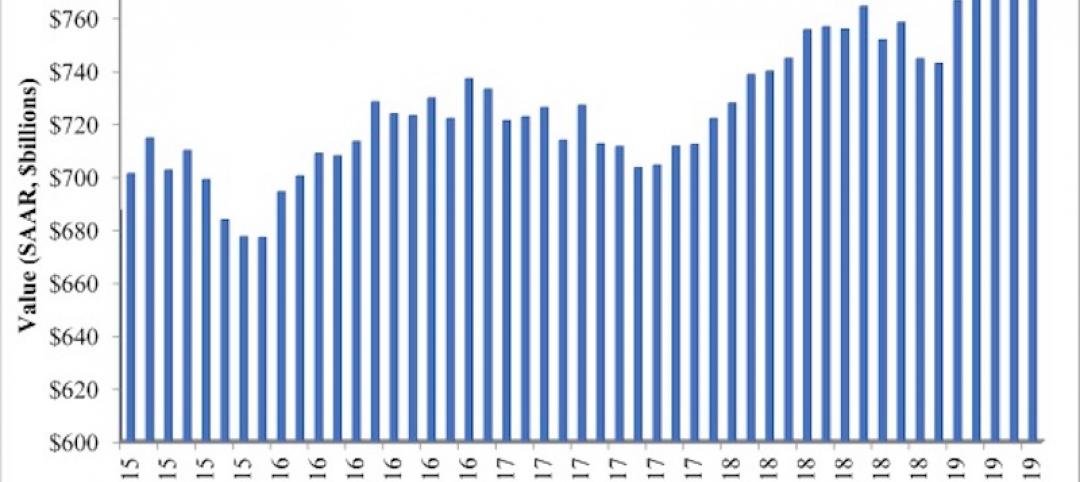
Nonresidential construction spending slips modestly in May
Among the 16 nonresidential construction spending categories tracked by the Census Bureau, five experienced increases in monthly spending.

Market Data | Jul 1, 2019
Almost 60% of the U.S. construction project pipeline value is concentrated in 10 major states
With a total of 1,302 projects worth $524.6 billion, California has both the largest number and value of projects in the U.S. construction project pipeline.

Market Data | Jun 21, 2019
Architecture billings remain flat
AIA’s Architecture Billings Index (ABI) score for May showed a small increase in design services at 50.2.

Market Data | Jun 19, 2019
Number of U.S. architects continues to rise
New data from NCARB reveals that the number of architects continues to increase.
Market Data | Jun 12, 2019
Construction input prices see slight increase in May
Among the 11 subcategories, six saw prices fall last month, with the largest decreases in natural gas.


