


Analysts at Lodging Econometrics (LE) report that at the fourth quarter close of 2021, the total U.S. hotel construction pipeline stands at 4,814 projects/581,953 rooms, down 8% by projects and 10% by rooms year-over-year (YOY). While project totals have dipped slightly YOY, the number of projects in the early planning stage continues to rise. In the final quarter of 2021, projects in the early planning stage experienced an 18% increase by projects and 11% by rooms YOY, for a total of 2,021 projects/239,816 rooms.
Projects scheduled to start construction in the next 12 months stand at 1,821 projects/210,890 rooms at the end of the fourth quarter. Projects under construction finished the year at 972 projects/131,247 rooms. New project announcements are down in the fourth quarter; however, developers are eager to accelerate projects long-delayed by the COVID-19 pandemic. Unfortunately, they face some development roadblocks, including escalating inflation and supply chain shortages, that are causing higher prices versus “pre-pandemic” costs for labor and materials. These factors continue to prolong hotel development timelines. We anticipate these challenges to abate throughout the year and see construction starts to moderately improve.
Nevertheless, the hotel industry has found some assurance in the recent resurgence of travel demand and the steady increase in hotel booking numbers over recent months. Pandemic exhaustion and pent-up demand for “get-aways” have led to a growing number of Americans becoming more open to travel. In addition to leisure travel, the business sector has a strong desire to travel and meet in person. LE analysts are expecting higher attendance at industry conferences and events after Q1‘22. This will help to raise hotel business demand and positively impact the industry as a whole.
Through year-end 2021, the U.S. opened 823 projects accounting for 105,705 rooms, for a growth rate of 1.9%. For 2022, LE is forecasting 783 projects/90,074 rooms to open at a supply growth rate of 1.6%. In 2023, continuing at a supply growth rate of 1.6%, another 820 projects/93,112 rooms are anticipated to open by year-end.
Related Stories
Market Data | Oct 14, 2021
Climate-related risk could be a major headwind for real estate investment
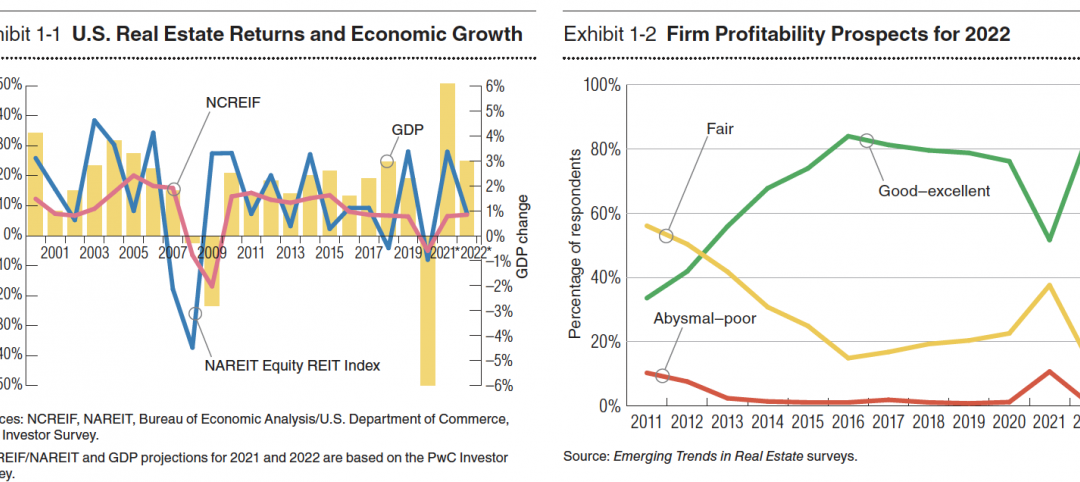
A new trends report from PwC and ULI picks Nashville as the top metro for CRE prospects.
Market Data | Oct 14, 2021
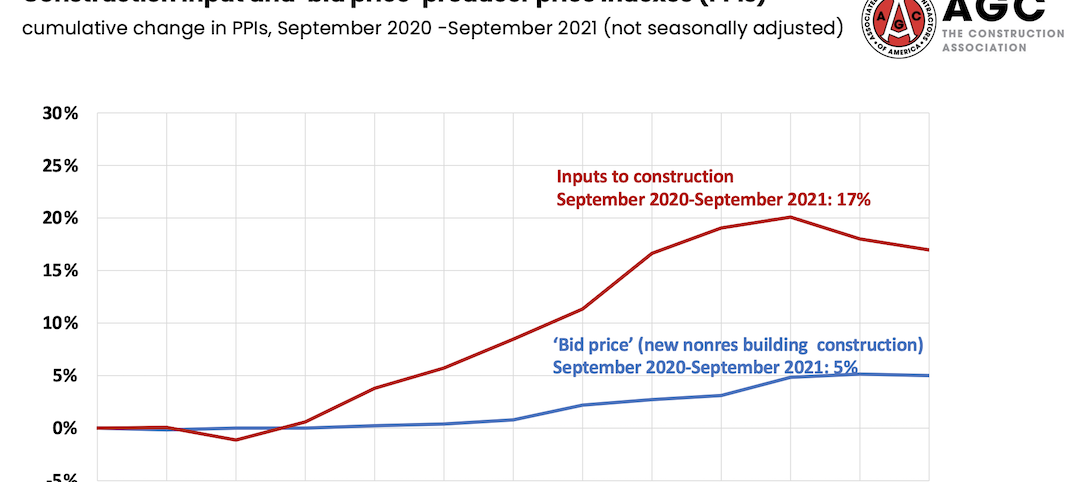
Prices for construction materials continue to outstrip bid prices over 12 months
Construction officials renew push for immediate removal of tariffs on key construction materials.
Market Data | Oct 11, 2021
No decline in construction costs in sight
Construction cost gains are occurring at a time when nonresidential construction spending was down by 9.5 percent for the 12 months through July 2021.
Market Data | Oct 11, 2021
Nonresidential construction sector posts first job gain since March
Has yet to hit pre-pandemic levels amid supply chain disruptions and delays.
Market Data | Oct 4, 2021
Construction spending stalls between July and August
A decrease in nonresidential projects negates ongoing growth in residential work.
Market Data | Oct 1, 2021
Nonresidential construction spending dips in August
Spending declined on a monthly basis in 10 of the 16 nonresidential subcategories.
Market Data | Sep 29, 2021
One-third of metro areas lost construction jobs between August 2020 and 2021
Lawrence-Methuen Town-Salem, Mass. and San Diego-Carlsbad, Calif. top lists of metros with year-over-year employment increases.
Market Data | Sep 28, 2021
Design-Build projects should continue to take bigger shares of construction spending pie over next five years
FMI’s new study finds collaboration and creativity are major reasons why owners and AEC firms prefer this delivery method.
Market Data | Sep 22, 2021
Architecture billings continue to increase
The ABI score for August was 55.6, up from July’s score of 54.6.

Market Data | Sep 20, 2021
August construction employment lags pre-pandemic peak in 39 states
The coronavirus delta variant and supply problems hold back recovery.


