


Analysts at Lodging Econometrics (LE) report that at the fourth quarter close of 2021, the total U.S. hotel construction pipeline stands at 4,814 projects/581,953 rooms, down 8% by projects and 10% by rooms year-over-year (YOY). While project totals have dipped slightly YOY, the number of projects in the early planning stage continues to rise. In the final quarter of 2021, projects in the early planning stage experienced an 18% increase by projects and 11% by rooms YOY, for a total of 2,021 projects/239,816 rooms.
Projects scheduled to start construction in the next 12 months stand at 1,821 projects/210,890 rooms at the end of the fourth quarter. Projects under construction finished the year at 972 projects/131,247 rooms. New project announcements are down in the fourth quarter; however, developers are eager to accelerate projects long-delayed by the COVID-19 pandemic. Unfortunately, they face some development roadblocks, including escalating inflation and supply chain shortages, that are causing higher prices versus “pre-pandemic” costs for labor and materials. These factors continue to prolong hotel development timelines. We anticipate these challenges to abate throughout the year and see construction starts to moderately improve.
Nevertheless, the hotel industry has found some assurance in the recent resurgence of travel demand and the steady increase in hotel booking numbers over recent months. Pandemic exhaustion and pent-up demand for “get-aways” have led to a growing number of Americans becoming more open to travel. In addition to leisure travel, the business sector has a strong desire to travel and meet in person. LE analysts are expecting higher attendance at industry conferences and events after Q1‘22. This will help to raise hotel business demand and positively impact the industry as a whole.
Through year-end 2021, the U.S. opened 823 projects accounting for 105,705 rooms, for a growth rate of 1.9%. For 2022, LE is forecasting 783 projects/90,074 rooms to open at a supply growth rate of 1.6%. In 2023, continuing at a supply growth rate of 1.6%, another 820 projects/93,112 rooms are anticipated to open by year-end.
Related Stories
Market Data | Jan 3, 2022
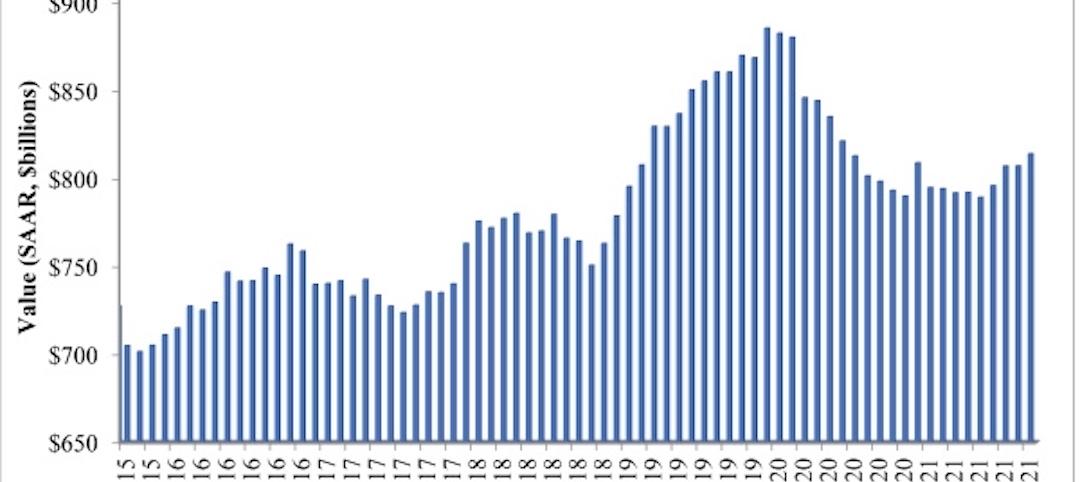
Construction spending in November increases from October and year ago
Construction spending in November totaled $1.63 trillion at a seasonally adjusted annual rate.

Market Data | Dec 22, 2021
Two out of three metro areas add construction jobs from November 2020 to November 2021
Construction employment increased in 237 or 66% of 358 metro areas over the last 12 months.
Market Data | Dec 17, 2021
Construction jobs exceed pre-pandemic level in 18 states and D.C.
Firms struggle to find qualified workers to keep up with demand.
Market Data | Dec 15, 2021
Widespread steep increases in materials costs in November outrun prices for construction projects
Construction officials say efforts to address supply chain challenges have been insufficient.

Market Data | Dec 15, 2021
Demand for design services continues to grow
Changing conditions could be on the horizon.

Market Data | Dec 5, 2021
Construction adds 31,000 jobs in November
Gains were in all segments, but the industry will need even more workers as demand accelerates.
Market Data | Dec 5, 2021
Construction spending rebounds in October
Growth in most public and private nonresidential types is offsetting the decline in residential work.
Market Data | Dec 5, 2021
Nonresidential construction spending increases nearly 1% in October
Spending was up on a monthly basis in 13 of the 16 nonresidential subcategories.
Market Data | Nov 30, 2021
Two-thirds of metro areas add construction jobs from October 2020 to October 2021
The pandemic and supply chain woes may limit gains.

Market Data | Nov 22, 2021
Only 16 states and D.C. added construction jobs since the pandemic began
Texas, Wyoming have worst job losses since February 2020, while Utah, South Dakota add the most.


