


ConstructConnect announced today the release of its Q3 2017 Forecast Quarterly Report. The U.S. grand total construction starts growth projection for 2017 over 2016 in ConstructConnect’s Q3 report has been revised down slightly to +4.5% from +4.8%. 2018 remains about the same at +5.9% year over year (y/y). Earlier, it had been estimated at +6.0%.
“The outlook for U.S. construction starts, as calculated by ConstructConnect, has diminished slightly in the short term,” said to Chief Economist Alex Carrick. “Prospects for some private sector project initiations (e.g., in retail) have stalled, while high hopes for an early launch of a much-needed super-infrastructure program, to be sponsored, promoted and perhaps largely financed by the new administration in Washington, have been deflated.”
The forecast which combines ConstructConnect's proprietary data with macroeconomic factors and Oxford Economics econometric expertise, shows the type-of-structure sub-categories among non-residential building starts that will have banner years in 2017:
- Hotels/motels (+38.2%)
- Warehouses (+16.3%)
- Sports stadiums (+47.3%)
- Courthouses (+110.0%)
The 2017 forecast for non-residential building starts was adjusted to -0.8% y/y, versus a flat (0.0%) performance that was expected in Q2’s forecast report. According to the forecast, non-residential building starts in 2018 will rebound to +3.3%, with private office buildings and industrial/manufacturing doing better with less downward drag being exerted by retail and medical projects. The boom in hotel/motel work will begin to lose steam.
Based on a heightened record of ‘actual’ starts through the first half of this year (+25.2%), civil/engineering starts in 2017 were revised upwards to +16.5% y/y from +8.9% in Q2’s report. 2018 growth in this category has also been raised, to +7.4% (from +5.8%).
The forecast includes a few notable high points in the 2017 y/y engineering sub-categories:
- Airports (+38.0%)
- Roads (+14.0%)
- Bridges (+31.0%)
- Power/oil and gas (+30.8%)
The report states among major sub-sectors, residential construction’s 2017 y/y increase has been scaled down to +4.8% from +8.1%. The robust multi-family market of the last several years has been pulling back of late, as rental rates in many regions soared. Single-family starts also stalled, despite a need for substantial growth activity, since they declined so horrendously in the Great Recession. Also, new family formations, specifically among millennials, point to a tremendous potential that for the moment is not being realized.
Related Stories

Market Data | Oct 19, 2021
Demand for design services continues to increase
The Architecture Billings Index (ABI) score for September was 56.6.
Market Data | Oct 14, 2021
Climate-related risk could be a major headwind for real estate investment
A new trends report from PwC and ULI picks Nashville as the top metro for CRE prospects.
Market Data | Oct 14, 2021
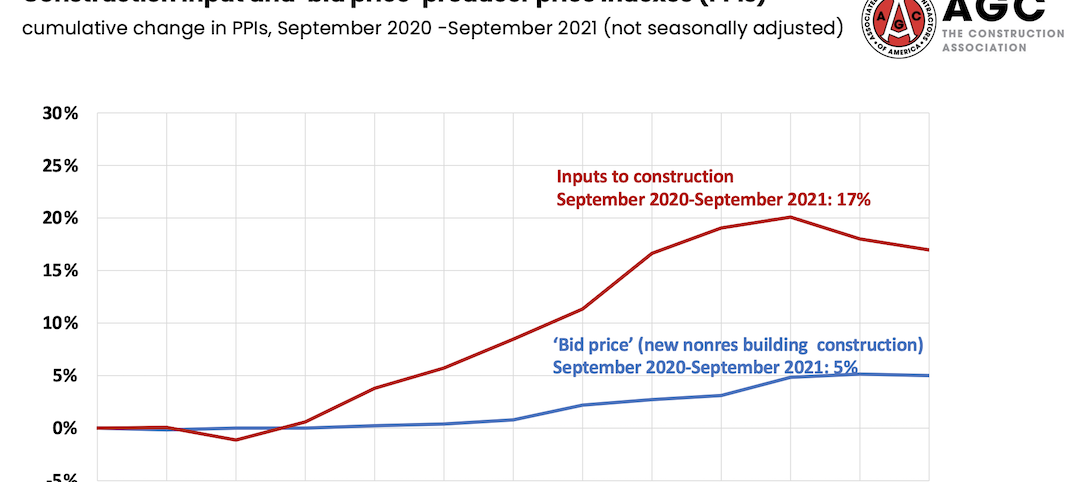
Prices for construction materials continue to outstrip bid prices over 12 months
Construction officials renew push for immediate removal of tariffs on key construction materials.
Market Data | Oct 11, 2021
No decline in construction costs in sight
Construction cost gains are occurring at a time when nonresidential construction spending was down by 9.5 percent for the 12 months through July 2021.
Market Data | Oct 11, 2021
Nonresidential construction sector posts first job gain since March
Has yet to hit pre-pandemic levels amid supply chain disruptions and delays.
Market Data | Oct 4, 2021
Construction spending stalls between July and August
A decrease in nonresidential projects negates ongoing growth in residential work.
Market Data | Oct 1, 2021
Nonresidential construction spending dips in August
Spending declined on a monthly basis in 10 of the 16 nonresidential subcategories.
Market Data | Sep 29, 2021
One-third of metro areas lost construction jobs between August 2020 and 2021
Lawrence-Methuen Town-Salem, Mass. and San Diego-Carlsbad, Calif. top lists of metros with year-over-year employment increases.
Market Data | Sep 28, 2021
Design-Build projects should continue to take bigger shares of construction spending pie over next five years
FMI’s new study finds collaboration and creativity are major reasons why owners and AEC firms prefer this delivery method.
Market Data | Sep 22, 2021
Architecture billings continue to increase
The ABI score for August was 55.6, up from July’s score of 54.6.


