

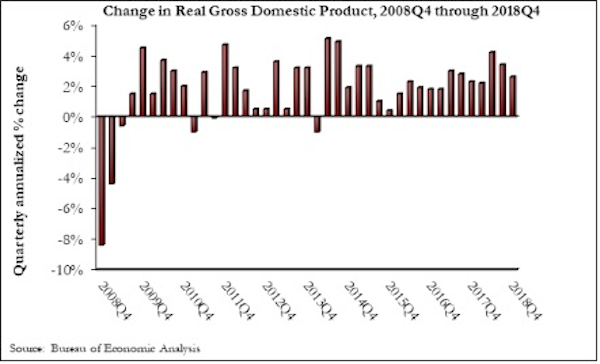
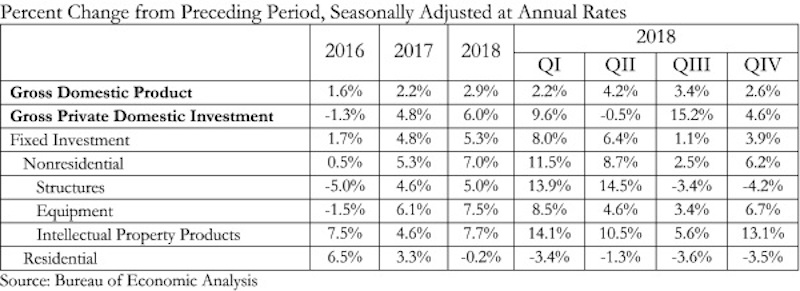
The U.S. economy grew at an annual rate of 2.6% in the fourth quarter of 2018, according to an Associated Builders and Contractors analysis of data published today by the U.S. Bureau of Economic Analysis. Year-over-year GDP growth was 3.1%, while average growth for 2018 was 2.9%.
“Today’s GDP report confirms continued strong investment in nonresidential segments in America,” said ABC Chief Economist Anirban Basu. “Separately, construction spending data show significant expenditures on the construction of data centers, hotel rooms, theme parks and fulfillment centers. These data also indicate stepped up public construction spending in categories such as transportation, education, and water systems. Despite that, today’s GDP release indicated that investment in nonresidential structures actually declined 4.2% on an annualized basis during last year’s fourth quarter. Despite that setback, this form of investment was up by 5% for the entirety of 2018.
“Undoubtedly, some attention will be given to the fact that the U.S. economy expanded by just shy of 3% in 2018,” said Basu. “Unless that figure is revised upward in subsequent releases, it will mean that America has failed to reach the 3% annual threshold since 2005. But while much attention will be given to a perceived shortfall in growth, the fourth quarter figure of 2.6% signifies that the U.S. economy entered this year with substantial momentum. Were it not for a weak residential construction sector, 3% growth would have been attained. Moreover, the data indicate strength in disposable income growth and in business investment.

“It is quite likely that the U.S. economy will expand at around 2% this year,” said Basu. “Though interest rates remain low and hiring is still brisk, a number of leading indicators suggest that the nation’s economy will soften somewhat during the quarters ahead, which can be partly attributed to a weakening global economy. This won’t unduly impact nonresidential construction activity, however, since the pace of activity in this segment tends to lag the overall economy, and strong nonresidential construction spending expected in 2019. Finally, ABC’s Construction Backlog Indicator continues to reflect strong demand for contractors, which have nearly nine months of work lined up.”
Related Stories

Market Data | May 16, 2017
Construction firms add 5,000 jobs in April
Unemployment down to 4.4%; Specialty trade jobs dip slightly.

Multifamily Housing | May 10, 2017
May 2017 National Apartment Report
Median one-bedroom rent rose to $1,012 in April, the highest it has been since January.

Senior Living Design | May 9, 2017
Designing for a future of limited mobility
There is an accessibility challenge facing the U.S. An estimated 1 in 5 people will be aged 65 or older by 2040.

Industry Research | May 4, 2017
How your AEC firm can go from the shortlist to winning new business
Here are four key lessons to help you close more business.

Engineers | May 3, 2017
At first buoyed by Trump election, U.S. engineers now less optimistic about markets, new survey shows
The first quarter 2017 (Q1/17) of ACEC’s Engineering Business Index (EBI) dipped slightly (0.5 points) to 66.0.

Market Data | May 2, 2017
Nonresidential Spending loses steam after strong start to year
Spending in the segment totaled $708.6 billion on a seasonally adjusted, annualized basis.

Market Data | May 1, 2017
Nonresidential Fixed Investment surges despite sluggish economic in first quarter
Real gross domestic product (GDP) expanded 0.7 percent on a seasonally adjusted annualized rate during the first three months of the year.

Industry Research | Apr 28, 2017
A/E Industry lacks planning, but still spending large on hiring
The average 200-person A/E Firm is spending $200,000 on hiring, and not budgeting at all.

Market Data | Apr 19, 2017
Architecture Billings Index continues to strengthen
Balanced growth results in billings gains in all regions.

Market Data | Apr 13, 2017
2016’s top 10 states for commercial development
Three new states creep into the top 10 while first and second place remain unchanged.


