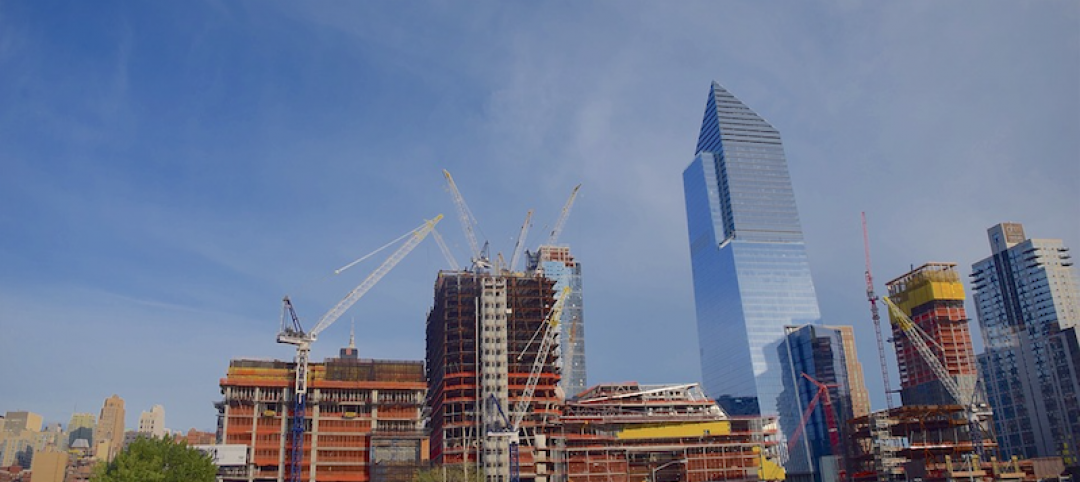
Analysts at Lodging Econometrics (LE) report that at the fourth quarter close of 2021, the total U.S. hotel construction pipeline stands at 4,814 projects/581,953 rooms, down 8% by projects and 10% by rooms year-over-year (YOY). While project totals have dipped slightly YOY, the number of projects in the early planning stage continues to rise. In the final quarter of 2021, projects in the early planning stage experienced an 18% increase by projects and 11% by rooms YOY, for a total of 2,021 projects/239,816 rooms.
Projects scheduled to start construction in the next 12 months stand at 1,821 projects/210,890 rooms at the end of the fourth quarter. Projects under construction finished the year at 972 projects/131,247 rooms. New project announcements are down in the fourth quarter; however, developers are eager to accelerate projects long-delayed by the COVID-19 pandemic. Unfortunately, they face some development roadblocks, including escalating inflation and supply chain shortages, that are causing higher prices versus “pre-pandemic” costs for labor and materials. These factors continue to prolong hotel development timelines. We anticipate these challenges to abate throughout the year and see construction starts to moderately improve.
Nevertheless, the hotel industry has found some assurance in the recent resurgence of travel demand and the steady increase in hotel booking numbers over recent months. Pandemic exhaustion and pent-up demand for “get-aways” have led to a growing number of Americans becoming more open to travel. In addition to leisure travel, the business sector has a strong desire to travel and meet in person. LE analysts are expecting higher attendance at industry conferences and events after Q1‘22. This will help to raise hotel business demand and positively impact the industry as a whole.
Through year-end 2021, the U.S. opened 823 projects accounting for 105,705 rooms, for a growth rate of 1.9%. For 2022, LE is forecasting 783 projects/90,074 rooms to open at a supply growth rate of 1.6%. In 2023, continuing at a supply growth rate of 1.6%, another 820 projects/93,112 rooms are anticipated to open by year-end.
Related Stories
Market Data | May 16, 2017
Construction firms add 5,000 jobs in April
Unemployment down to 4.4%; Specialty trade jobs dip slightly.
Multifamily Housing | May 10, 2017
May 2017 National Apartment Report
Median one-bedroom rent rose to $1,012 in April, the highest it has been since January.
Senior Living Design | May 9, 2017
Designing for a future of limited mobility
There is an accessibility challenge facing the U.S. An estimated 1 in 5 people will be aged 65 or older by 2040.
Industry Research | May 4, 2017
How your AEC firm can go from the shortlist to winning new business
Here are four key lessons to help you close more business.
Engineers | May 3, 2017
At first buoyed by Trump election, U.S. engineers now less optimistic about markets, new survey shows
The first quarter 2017 (Q1/17) of ACEC’s Engineering Business Index (EBI) dipped slightly (0.5 points) to 66.0.
Market Data | May 2, 2017
Nonresidential Spending loses steam after strong start to year
Spending in the segment totaled $708.6 billion on a seasonally adjusted, annualized basis.
Market Data | May 1, 2017
Nonresidential Fixed Investment surges despite sluggish economic in first quarter
Real gross domestic product (GDP) expanded 0.7 percent on a seasonally adjusted annualized rate during the first three months of the year.
Industry Research | Apr 28, 2017
A/E Industry lacks planning, but still spending large on hiring
The average 200-person A/E Firm is spending $200,000 on hiring, and not budgeting at all.
Market Data | Apr 19, 2017
Architecture Billings Index continues to strengthen
Balanced growth results in billings gains in all regions.
Market Data | Apr 13, 2017
2016’s top 10 states for commercial development
Three new states creep into the top 10 while first and second place remain unchanged.


