

Clean, well-maintained restrooms play a bigger role in a student’s perception of a school as a whole than one may think.
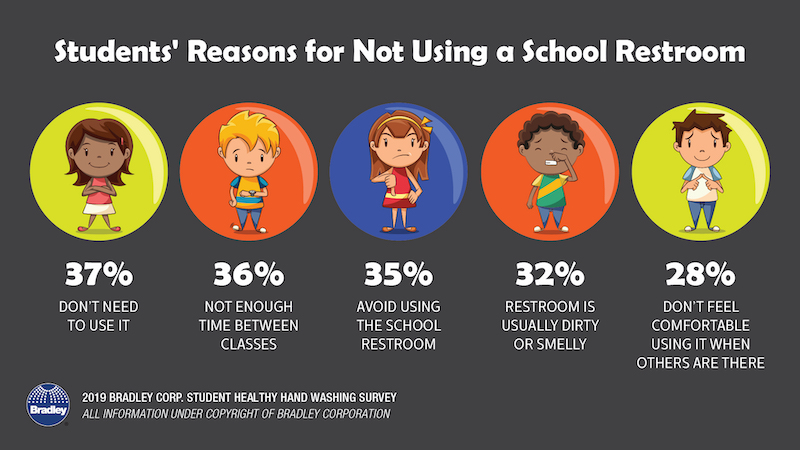
According to Bradley Corporation’s new Healthy Hand Washing Survey of 9th to 12th graders, 68% of students say school restrooms that are poorly maintained or unclean show the school doesn’t care about its students, reflects poor school management, and lowers their overall opinion of the school. 19% of the students surveyed say they never frequent school bathrooms, in part because they are dirty, smelly, or have broken or old toilets, sinks, and doors.
Students’ top request for how to improve the restrooms is more privacy; they want taller stall doors and to eliminate gaps between stall panels. Their second request is for cleaner facilities, with more air fresheners as the third request. Foul odors tops the list of what bothers them most about school restrooms. When confronted with a dirty bathroom, over half of the students say they leave without using it, and 39% say they try to avoid using that bathroom in the future.
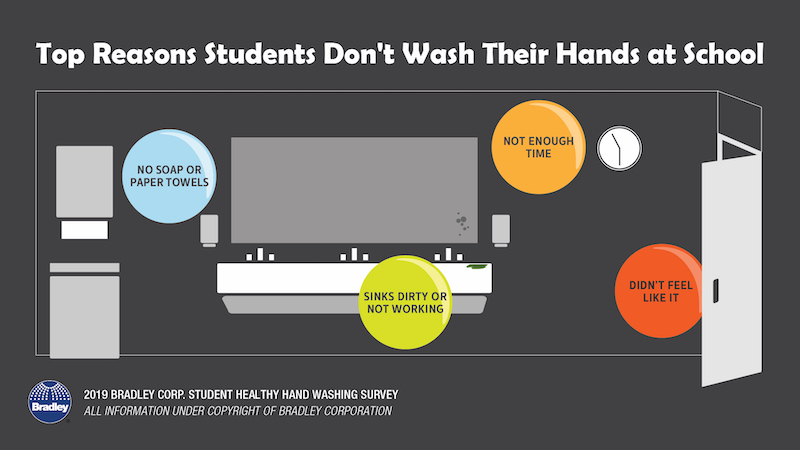
The top reasons students skipped washing their hands after using the bathroom are: no soap or paper towels, the sinks are dirty or don’t work, not enough time, and they just didn’t feel like it. While most school’s don’t post hand washing reminders in their bathrooms (only 34% of schools say they do), 57% of students say they’d be more likely to wash if there was a sign.
Related Stories

Industry Research | Apr 28, 2017
A/E Industry lacks planning, but still spending large on hiring
The average 200-person A/E Firm is spending $200,000 on hiring, and not budgeting at all.

Market Data | Apr 19, 2017
Architecture Billings Index continues to strengthen
Balanced growth results in billings gains in all regions.

Market Data | Apr 13, 2017
2016’s top 10 states for commercial development
Three new states creep into the top 10 while first and second place remain unchanged.

Market Data | Apr 6, 2017
Architecture marketing: 5 tools to measure success
We’ve identified five architecture marketing tools that will help your firm evaluate if it’s on the track to more leads, higher growth, and broader brand visibility.

Market Data | Apr 3, 2017
Public nonresidential construction spending rebounds; overall spending unchanged in February
The segment totaled $701.9 billion on a seasonally adjusted annualized rate for the month, marking the seventh consecutive month in which nonresidential spending sat above the $700 billion threshold.

Market Data | Mar 29, 2017
Contractor confidence ends 2016 down but still in positive territory
Although all three diffusion indices in the survey fell by more than five points they remain well above the threshold of 50, which signals that construction activity will continue to be one of the few significant drivers of economic growth.

Market Data | Mar 24, 2017
These are the most and least innovative states for 2017
Connecticut, Virginia, and Maryland are all in the top 10 most innovative states, but none of them were able to claim the number one spot.

Market Data | Mar 22, 2017
After a strong year, construction industry anxious about Washington’s proposed policy shifts
Impacts on labor and materials costs at issue, according to latest JLL report.

Market Data | Mar 22, 2017
Architecture Billings Index rebounds into positive territory
Business conditions projected to solidify moving into the spring and summer.

Market Data | Mar 15, 2017
ABC's Construction Backlog Indicator fell to end 2016
Contractors in each segment surveyed all saw lower backlog during the fourth quarter, with firms in the heavy industrial segment experiencing the largest drop.


