

Clean, well-maintained restrooms play a bigger role in a student’s perception of a school as a whole than one may think.
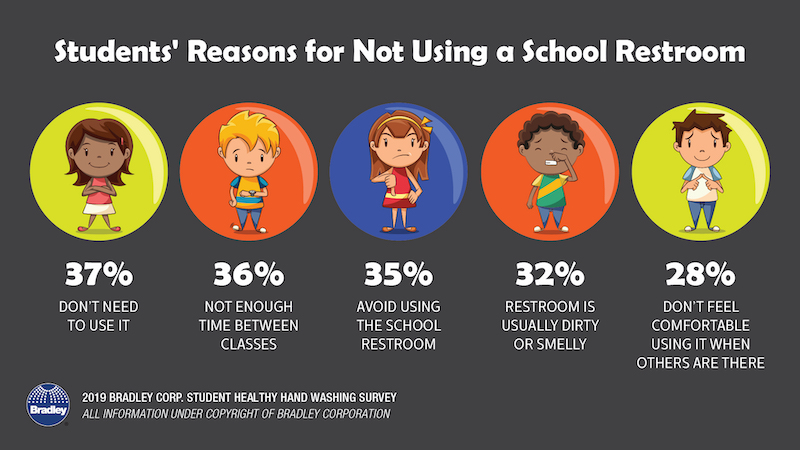
According to Bradley Corporation’s new Healthy Hand Washing Survey of 9th to 12th graders, 68% of students say school restrooms that are poorly maintained or unclean show the school doesn’t care about its students, reflects poor school management, and lowers their overall opinion of the school. 19% of the students surveyed say they never frequent school bathrooms, in part because they are dirty, smelly, or have broken or old toilets, sinks, and doors.
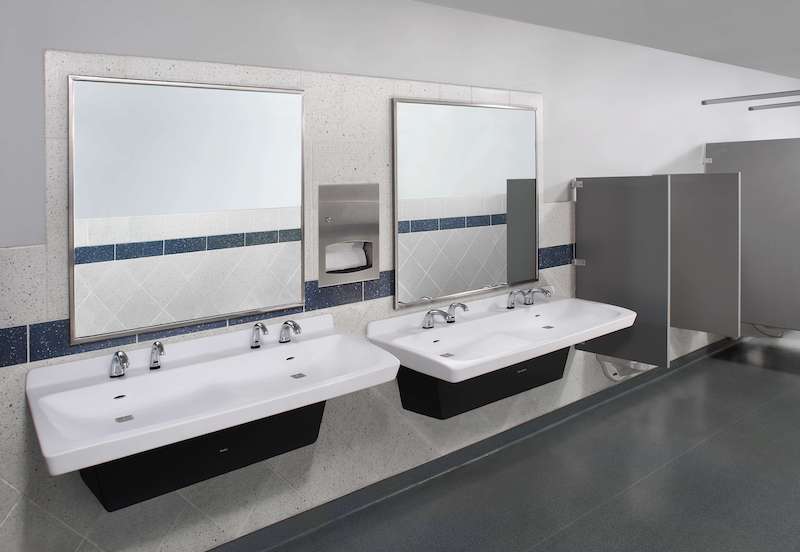
Students’ top request for how to improve the restrooms is more privacy; they want taller stall doors and to eliminate gaps between stall panels. Their second request is for cleaner facilities, with more air fresheners as the third request. Foul odors tops the list of what bothers them most about school restrooms. When confronted with a dirty bathroom, over half of the students say they leave without using it, and 39% say they try to avoid using that bathroom in the future.
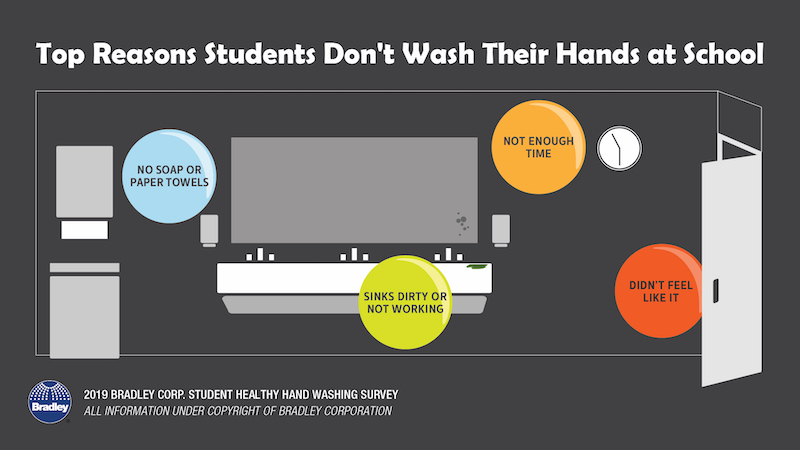
The top reasons students skipped washing their hands after using the bathroom are: no soap or paper towels, the sinks are dirty or don’t work, not enough time, and they just didn’t feel like it. While most school’s don’t post hand washing reminders in their bathrooms (only 34% of schools say they do), 57% of students say they’d be more likely to wash if there was a sign.
Related Stories

Market Data | May 24, 2017
Design billings increasing entering height of construction season
All regions report positive business conditions.

Market Data | May 24, 2017
The top franchise companies in the construction pipeline
3 franchise companies comprise 65% of all rooms in the Total Pipeline.

Industry Research | May 24, 2017
These buildings paid the highest property taxes in 2016
Office buildings dominate the list, but a residential community climbed as high as number two on the list.

Market Data | May 16, 2017
Construction firms add 5,000 jobs in April
Unemployment down to 4.4%; Specialty trade jobs dip slightly.

Multifamily Housing | May 10, 2017
May 2017 National Apartment Report
Median one-bedroom rent rose to $1,012 in April, the highest it has been since January.

Senior Living Design | May 9, 2017
Designing for a future of limited mobility
There is an accessibility challenge facing the U.S. An estimated 1 in 5 people will be aged 65 or older by 2040.

Industry Research | May 4, 2017
How your AEC firm can go from the shortlist to winning new business
Here are four key lessons to help you close more business.

Engineers | May 3, 2017
At first buoyed by Trump election, U.S. engineers now less optimistic about markets, new survey shows
The first quarter 2017 (Q1/17) of ACEC’s Engineering Business Index (EBI) dipped slightly (0.5 points) to 66.0.

Market Data | May 2, 2017
Nonresidential Spending loses steam after strong start to year
Spending in the segment totaled $708.6 billion on a seasonally adjusted, annualized basis.

Market Data | May 1, 2017
Nonresidential Fixed Investment surges despite sluggish economic in first quarter
Real gross domestic product (GDP) expanded 0.7 percent on a seasonally adjusted annualized rate during the first three months of the year.


