

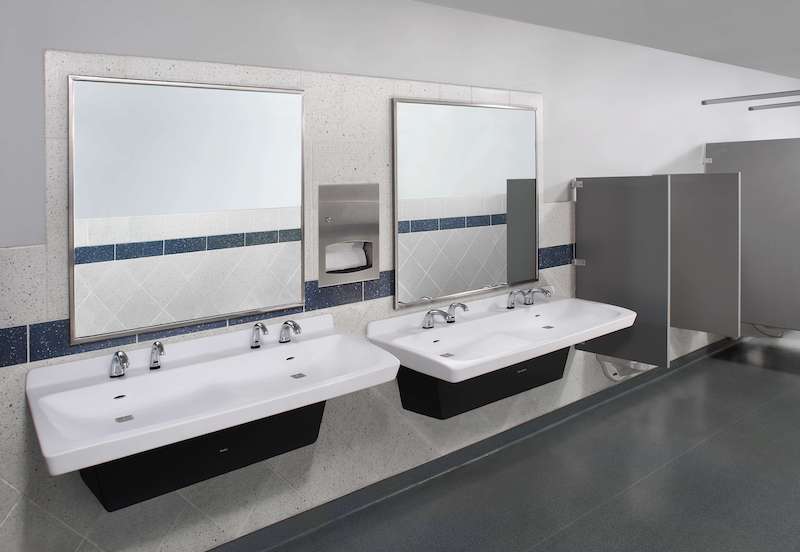
Clean, well-maintained restrooms play a bigger role in a student’s perception of a school as a whole than one may think.
According to Bradley Corporation’s new Healthy Hand Washing Survey of 9th to 12th graders, 68% of students say school restrooms that are poorly maintained or unclean show the school doesn’t care about its students, reflects poor school management, and lowers their overall opinion of the school. 19% of the students surveyed say they never frequent school bathrooms, in part because they are dirty, smelly, or have broken or old toilets, sinks, and doors.
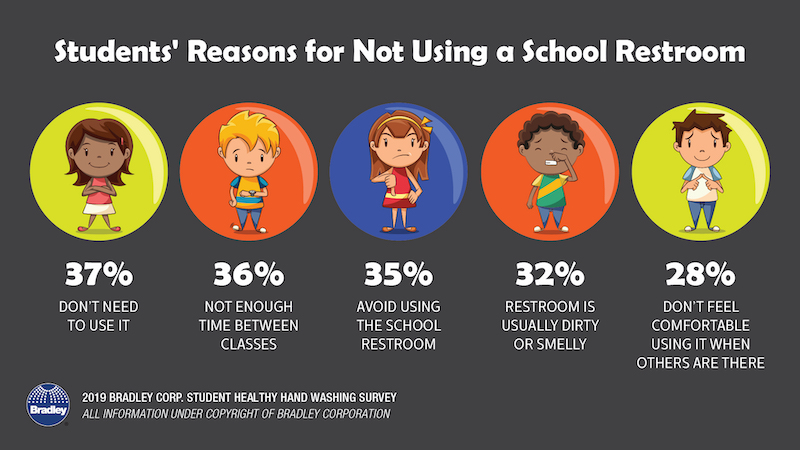
Students’ top request for how to improve the restrooms is more privacy; they want taller stall doors and to eliminate gaps between stall panels. Their second request is for cleaner facilities, with more air fresheners as the third request. Foul odors tops the list of what bothers them most about school restrooms. When confronted with a dirty bathroom, over half of the students say they leave without using it, and 39% say they try to avoid using that bathroom in the future.
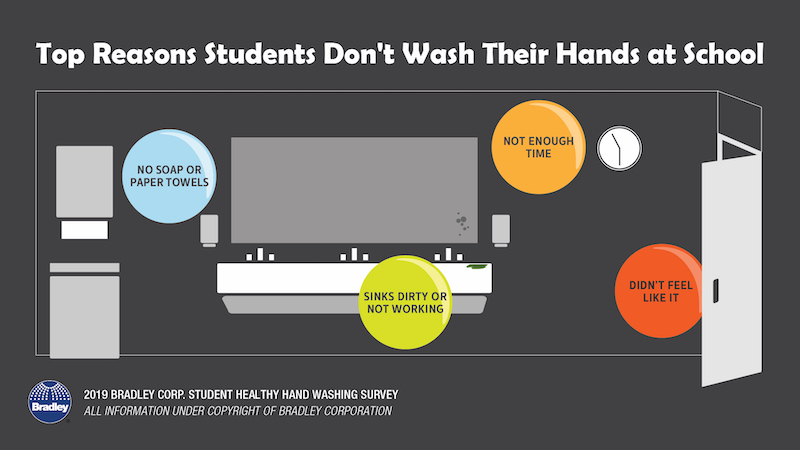
The top reasons students skipped washing their hands after using the bathroom are: no soap or paper towels, the sinks are dirty or don’t work, not enough time, and they just didn’t feel like it. While most school’s don’t post hand washing reminders in their bathrooms (only 34% of schools say they do), 57% of students say they’d be more likely to wash if there was a sign.
Related Stories

Market Data | Sep 3, 2019
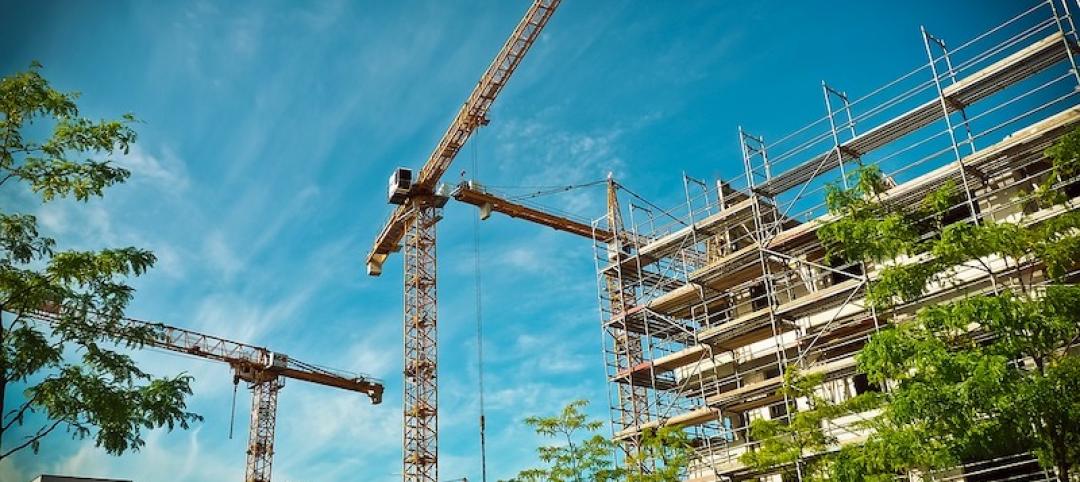
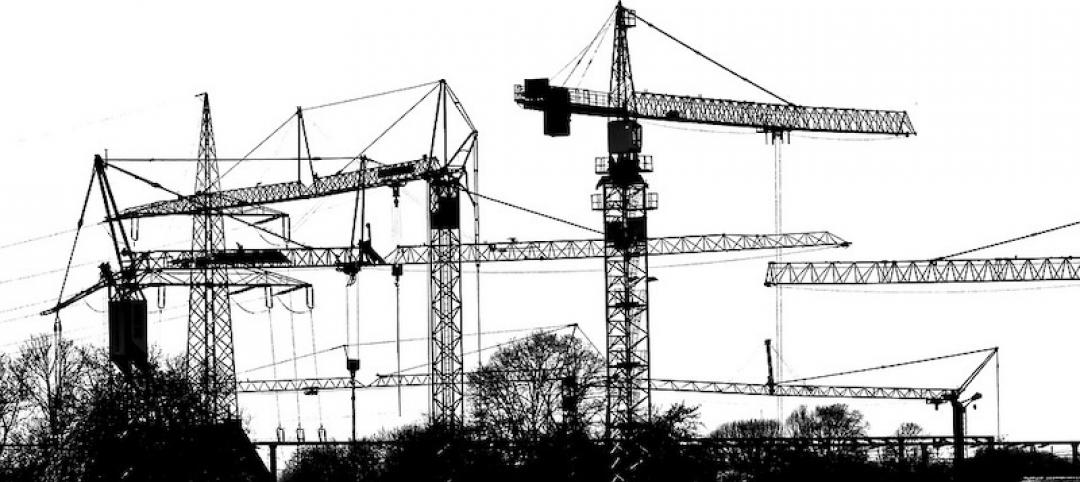
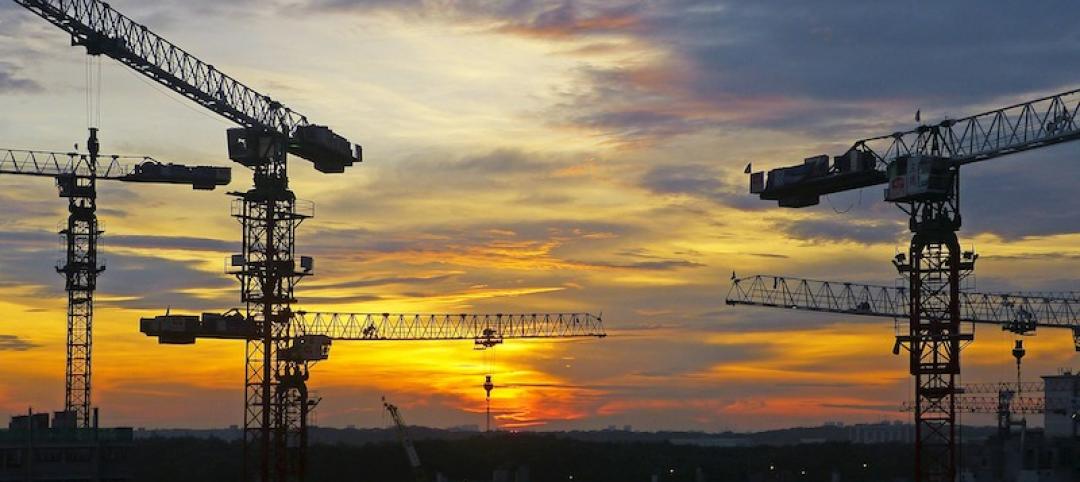
Nonresidential construction spending slips in July 2019, but still surpasses $776 billion
Construction spending declined 0.3% in July, totaling $776 billion on a seasonally adjusted annualized basis.
Industry Research | Aug 29, 2019
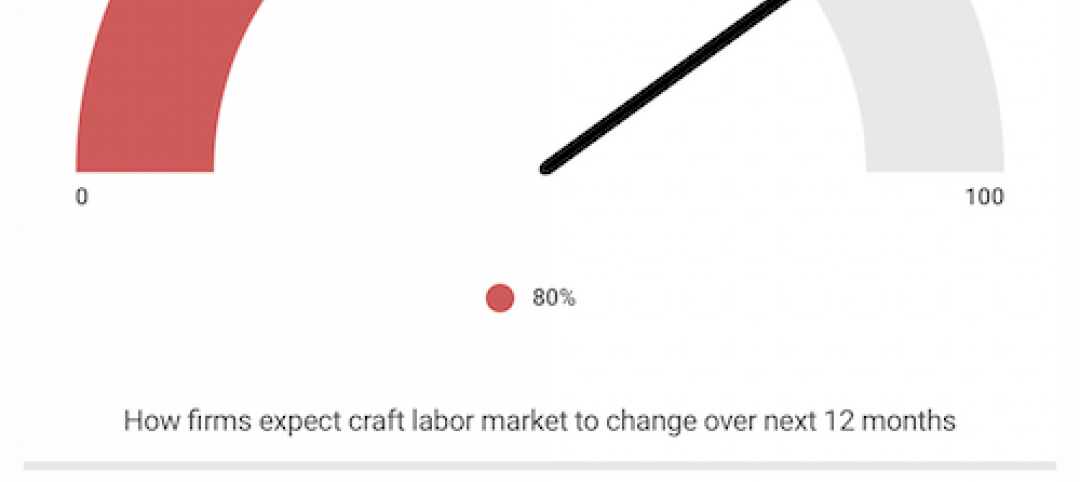
Construction firms expect labor shortages to worsen over the next year
A new AGC-Autodesk survey finds more companies turning to technology to support their jobsites.
Market Data | Aug 21, 2019
Architecture Billings Index continues its streak of soft readings
Decline in new design contracts suggests volatility in design activity to persist.
Market Data | Aug 19, 2019
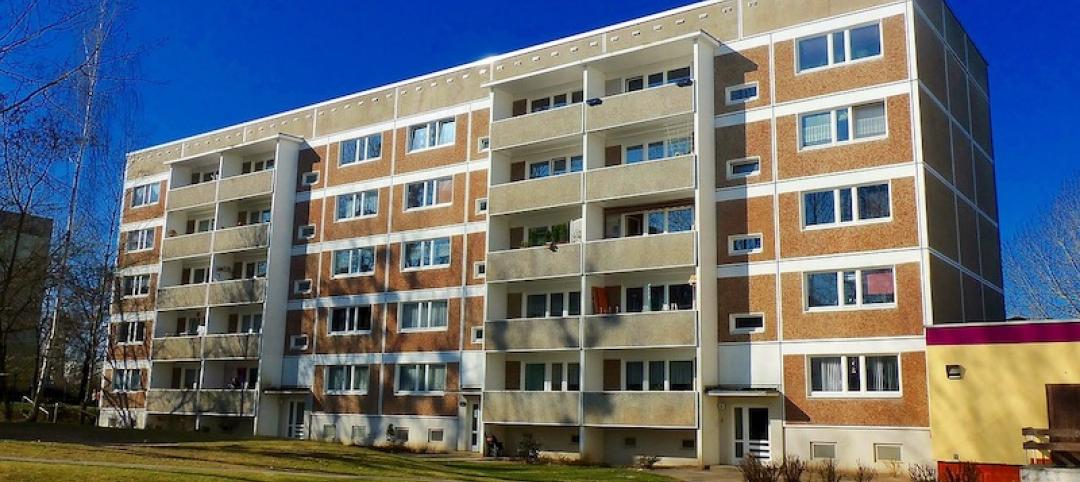
Multifamily market sustains positive cycle
Year-over-year growth tops 3% for 13th month. Will the economy stifle momentum?
Market Data | Aug 12, 2019
Mid-year economic outlook for nonresidential construction: Expansion continues, but vulnerabilities pile up
Emerging weakness in business investment has been hinting at softening outlays.
Market Data | Aug 7, 2019
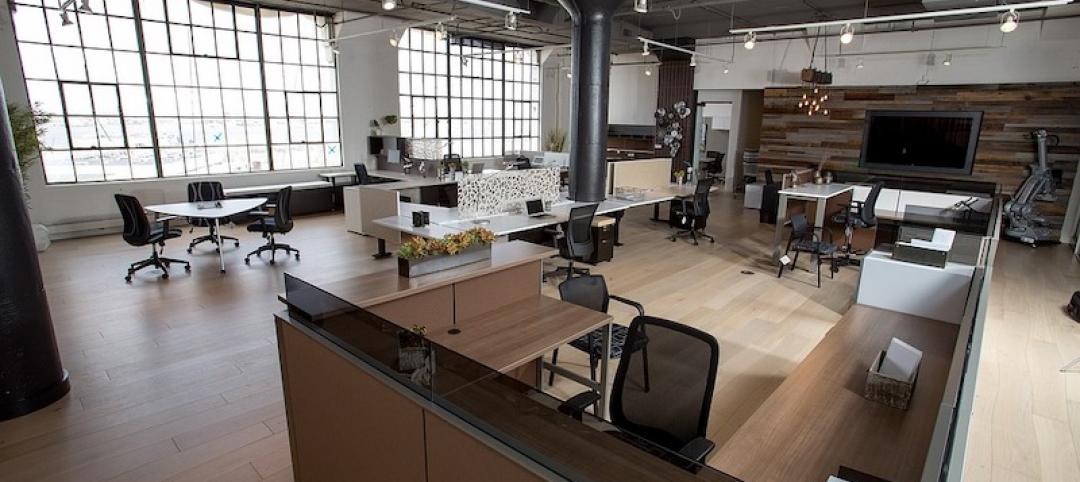
National office vacancy holds steady at 9.7% in slowing but disciplined market
Average asking rental rate posts 4.2% annual growth.
Market Data | Aug 1, 2019
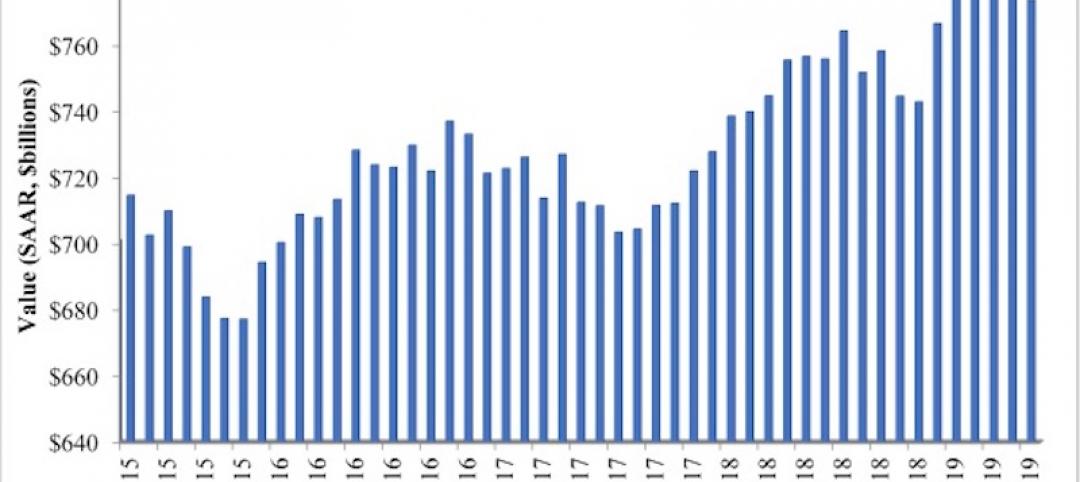
Nonresidential construction spending slows in June, remains elevated
Among the 16 nonresidential construction spending categories tracked by the Census Bureau, seven experienced increases in monthly spending.

Market Data | Jul 31, 2019
For the second quarter of 2019, the U.S. hotel construction pipeline continued its year-over-year growth spurt
The growth spurt continued even as business investment declined for the first time since 2016.
Market Data | Jul 23, 2019
Despite signals of impending declines, continued growth in nonresidential construction is expected through 2020
AIA’s latest Consensus Construction Forecast predicts growth.
Market Data | Jul 20, 2019
Construction costs continued to rise in second quarter
Labor availability is a big factor in that inflation, according to Rider Levett Bucknall report.


