

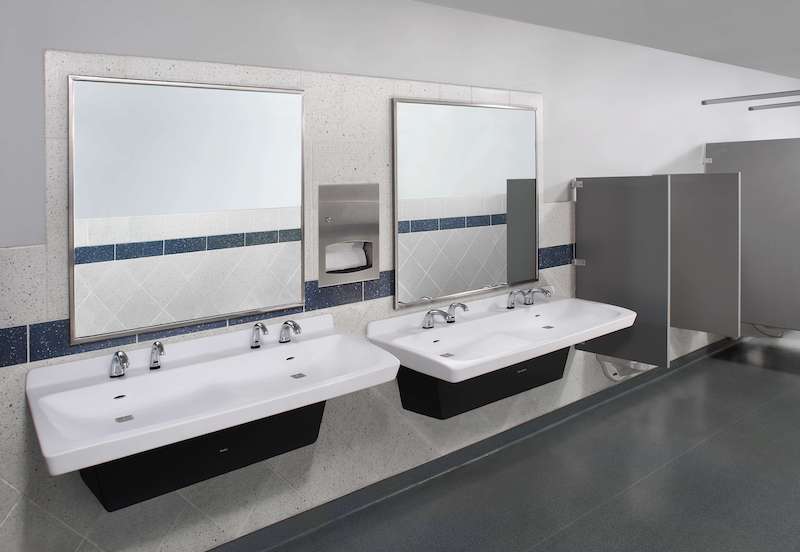
Clean, well-maintained restrooms play a bigger role in a student’s perception of a school as a whole than one may think.
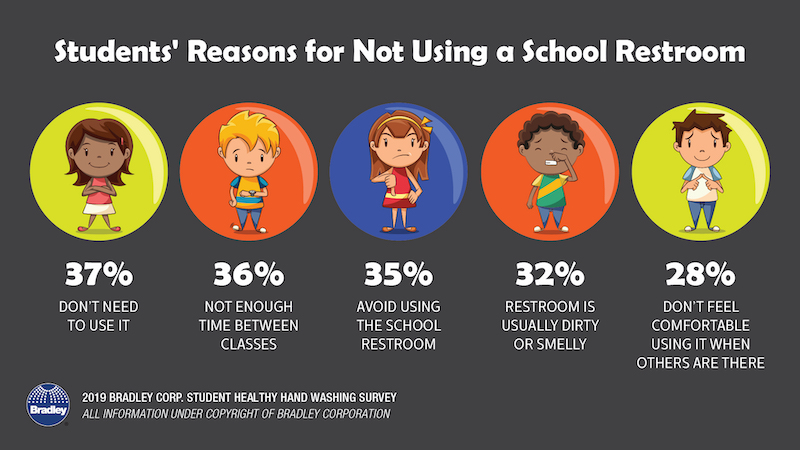
According to Bradley Corporation’s new Healthy Hand Washing Survey of 9th to 12th graders, 68% of students say school restrooms that are poorly maintained or unclean show the school doesn’t care about its students, reflects poor school management, and lowers their overall opinion of the school. 19% of the students surveyed say they never frequent school bathrooms, in part because they are dirty, smelly, or have broken or old toilets, sinks, and doors.
Students’ top request for how to improve the restrooms is more privacy; they want taller stall doors and to eliminate gaps between stall panels. Their second request is for cleaner facilities, with more air fresheners as the third request. Foul odors tops the list of what bothers them most about school restrooms. When confronted with a dirty bathroom, over half of the students say they leave without using it, and 39% say they try to avoid using that bathroom in the future.
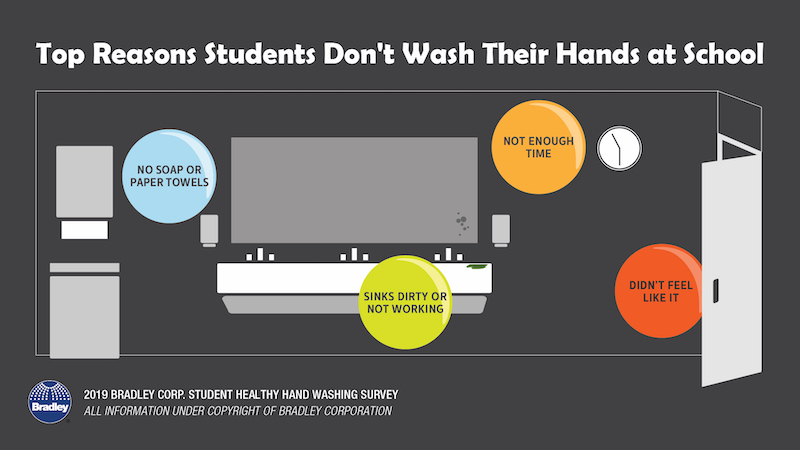
The top reasons students skipped washing their hands after using the bathroom are: no soap or paper towels, the sinks are dirty or don’t work, not enough time, and they just didn’t feel like it. While most school’s don’t post hand washing reminders in their bathrooms (only 34% of schools say they do), 57% of students say they’d be more likely to wash if there was a sign.
Related Stories

Market Data | Oct 19, 2021
Demand for design services continues to increase
The Architecture Billings Index (ABI) score for September was 56.6.
Market Data | Oct 14, 2021
Climate-related risk could be a major headwind for real estate investment
A new trends report from PwC and ULI picks Nashville as the top metro for CRE prospects.
Market Data | Oct 14, 2021
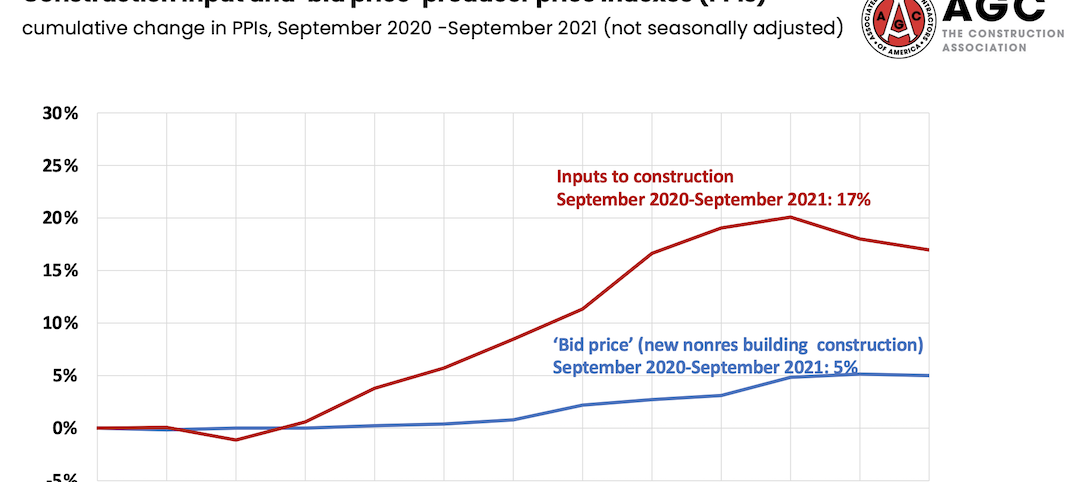
Prices for construction materials continue to outstrip bid prices over 12 months
Construction officials renew push for immediate removal of tariffs on key construction materials.
Market Data | Oct 11, 2021
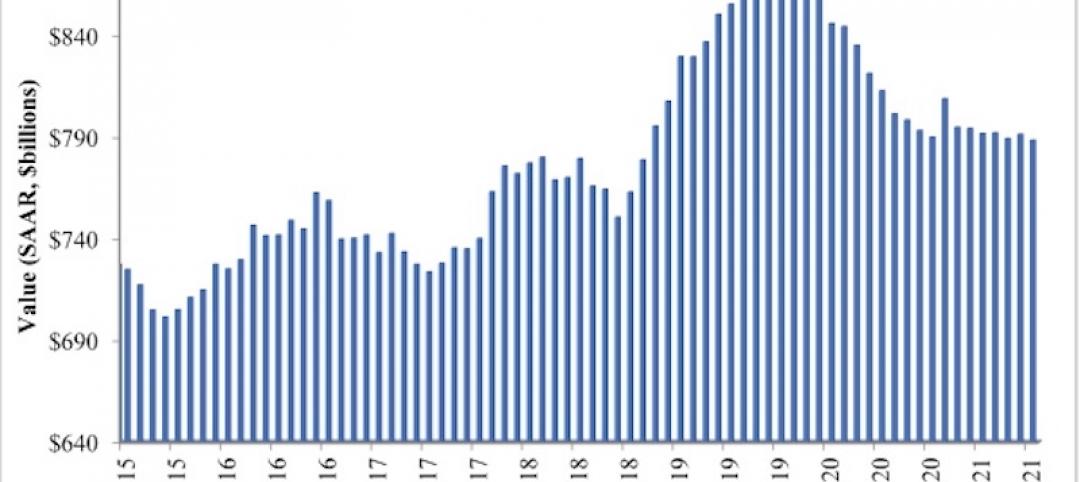
No decline in construction costs in sight
Construction cost gains are occurring at a time when nonresidential construction spending was down by 9.5 percent for the 12 months through July 2021.
Market Data | Oct 11, 2021
Nonresidential construction sector posts first job gain since March
Has yet to hit pre-pandemic levels amid supply chain disruptions and delays.
Market Data | Oct 4, 2021
Construction spending stalls between July and August
A decrease in nonresidential projects negates ongoing growth in residential work.
Market Data | Oct 1, 2021
Nonresidential construction spending dips in August
Spending declined on a monthly basis in 10 of the 16 nonresidential subcategories.
Market Data | Sep 29, 2021
One-third of metro areas lost construction jobs between August 2020 and 2021
Lawrence-Methuen Town-Salem, Mass. and San Diego-Carlsbad, Calif. top lists of metros with year-over-year employment increases.
Market Data | Sep 28, 2021
Design-Build projects should continue to take bigger shares of construction spending pie over next five years
FMI’s new study finds collaboration and creativity are major reasons why owners and AEC firms prefer this delivery method.
Market Data | Sep 22, 2021
Architecture billings continue to increase
The ABI score for August was 55.6, up from July’s score of 54.6.


