

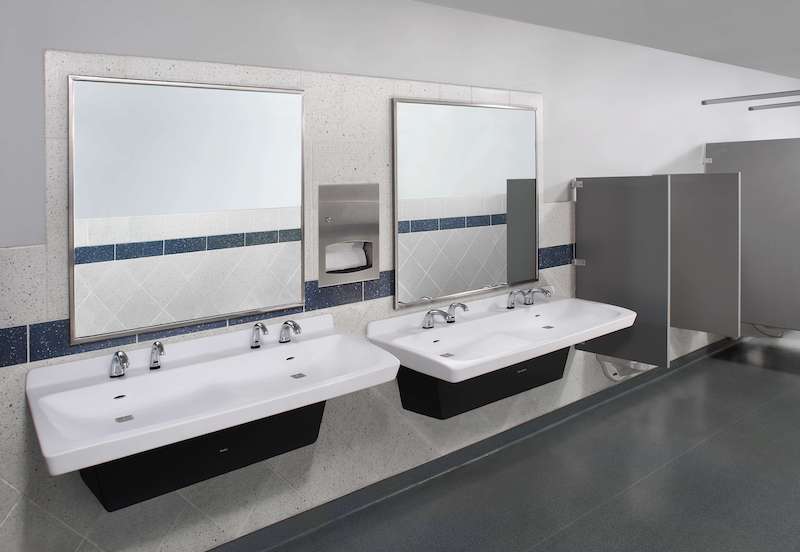
Clean, well-maintained restrooms play a bigger role in a student’s perception of a school as a whole than one may think.
According to Bradley Corporation’s new Healthy Hand Washing Survey of 9th to 12th graders, 68% of students say school restrooms that are poorly maintained or unclean show the school doesn’t care about its students, reflects poor school management, and lowers their overall opinion of the school. 19% of the students surveyed say they never frequent school bathrooms, in part because they are dirty, smelly, or have broken or old toilets, sinks, and doors.
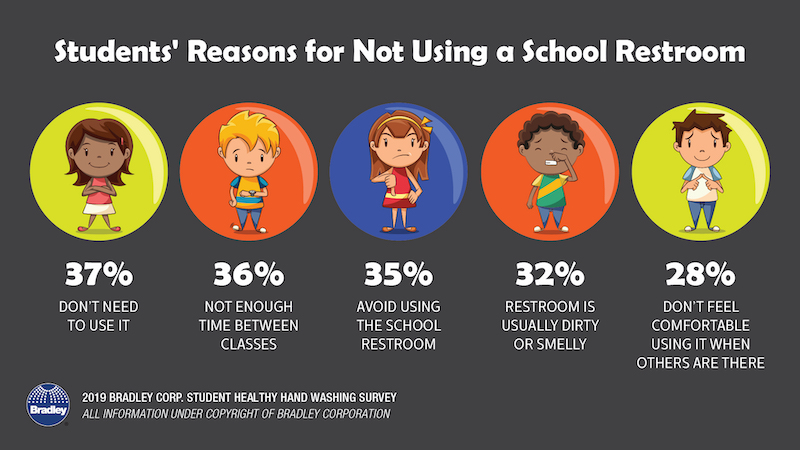
Students’ top request for how to improve the restrooms is more privacy; they want taller stall doors and to eliminate gaps between stall panels. Their second request is for cleaner facilities, with more air fresheners as the third request. Foul odors tops the list of what bothers them most about school restrooms. When confronted with a dirty bathroom, over half of the students say they leave without using it, and 39% say they try to avoid using that bathroom in the future.
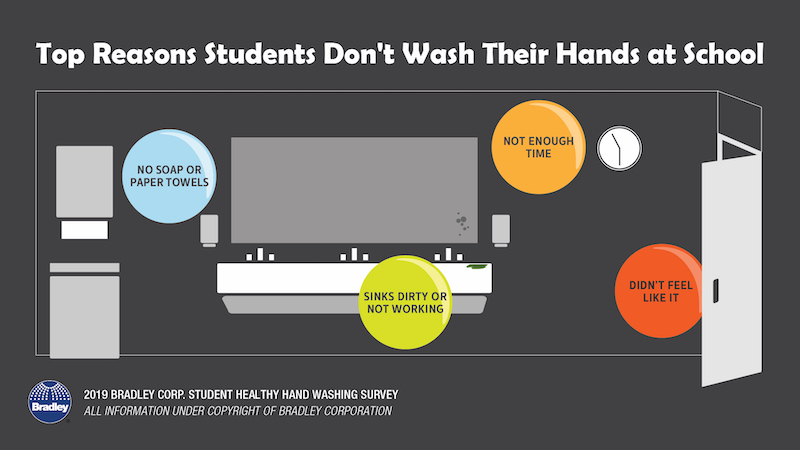
The top reasons students skipped washing their hands after using the bathroom are: no soap or paper towels, the sinks are dirty or don’t work, not enough time, and they just didn’t feel like it. While most school’s don’t post hand washing reminders in their bathrooms (only 34% of schools say they do), 57% of students say they’d be more likely to wash if there was a sign.
Related Stories

Market Data | Jan 6, 2022
A new survey offers a snapshot of New York’s construction market
Anchin’s poll of 20 AEC clients finds a “growing optimism,” but also multiple pressure points.
Market Data | Jan 3, 2022
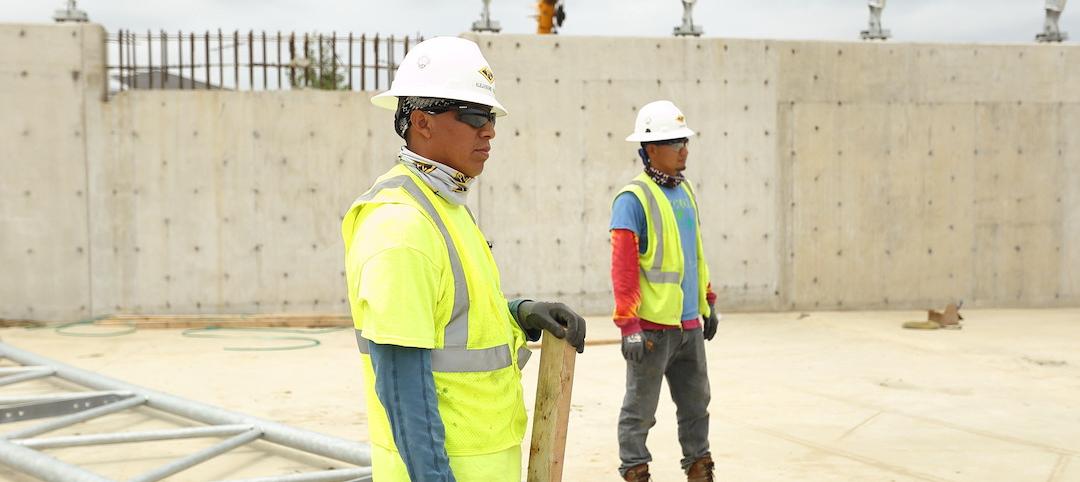
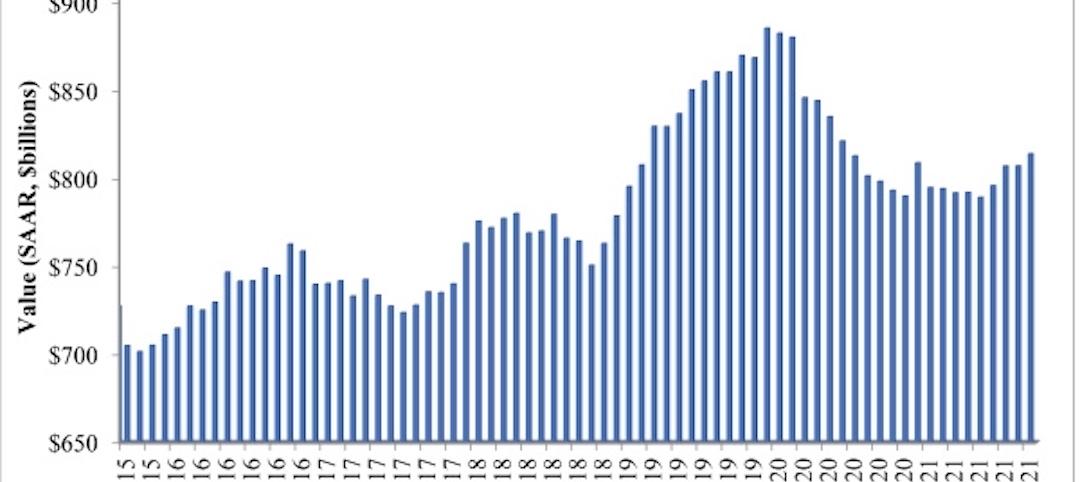
Construction spending in November increases from October and year ago
Construction spending in November totaled $1.63 trillion at a seasonally adjusted annual rate.
Market Data | Dec 22, 2021
Two out of three metro areas add construction jobs from November 2020 to November 2021
Construction employment increased in 237 or 66% of 358 metro areas over the last 12 months.
Market Data | Dec 17, 2021
Construction jobs exceed pre-pandemic level in 18 states and D.C.
Firms struggle to find qualified workers to keep up with demand.
Market Data | Dec 15, 2021
Widespread steep increases in materials costs in November outrun prices for construction projects
Construction officials say efforts to address supply chain challenges have been insufficient.

Market Data | Dec 15, 2021
Demand for design services continues to grow
Changing conditions could be on the horizon.
Market Data | Dec 5, 2021
Construction adds 31,000 jobs in November
Gains were in all segments, but the industry will need even more workers as demand accelerates.
Market Data | Dec 5, 2021
Construction spending rebounds in October
Growth in most public and private nonresidential types is offsetting the decline in residential work.
Market Data | Dec 5, 2021
Nonresidential construction spending increases nearly 1% in October
Spending was up on a monthly basis in 13 of the 16 nonresidential subcategories.
Market Data | Nov 30, 2021
Two-thirds of metro areas add construction jobs from October 2020 to October 2021
The pandemic and supply chain woes may limit gains.


