


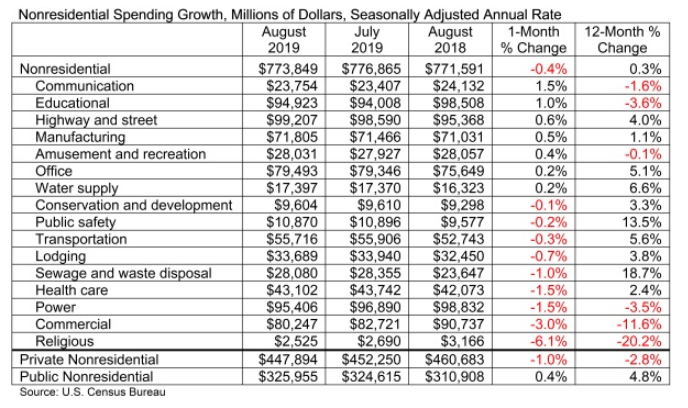
National nonresidential construction spending declined 0.4% in August, according to an Associated Builders and Contractors analysis of U.S. Census Bureau data published today. On a seasonally adjusted annualized basis, spending totaled $773.8 billion, 0.3% higher than in August 2018.
Private nonresidential spending fell 1% on a monthly basis and is down 2.8% compared to the same time last year. Public nonresidential construction expanded 0.4% for the month and 4.8% for the year.
"Nonresidential construction spending is down nearly 3% from its peak in April 2019 due to declines in private construction,” said ABC Chief Economist Anirban Basu. "Construction spending in the commercial category, which encompasses retail space among other segments, is down nearly 12% on a year-over-year basis. Spending related to lodging, including new hotel construction, was down 0.7% for the month and is up less than 4% year over year. Spending in the power segment also decreased in August and is down 3.5% compared to the same time last year."
“All of this is consistent with a slowing economy, especially as measures such as industrial production and capacity utilization remain stagnant,” said Basu. “While this could be attributed to trade wars and a slowing global economy, construction dynamics are rarely so simple. Another likely explanation is that America’s growing shortage of skilled construction workers has driven up the cost of delivering construction services, even in the context of flat materials prices, resulting in more project owners delaying projects.
“On the other hand, public construction spending continues to rise,” said Basu. “Construction spending on public safety is up 13.5% on a year-over-year basis and spending in the sewage/waste disposal category is up nearly 19%. State and local governments continue to benefit from an economy that has pushed property tax, sales tax and income tax collections higher. Low borrowing costs also serve as an inducement to leverage revenues with debt, resulting in more infrastructure spending. Given the recent path of interest rates, this dynamic should continue into 2020.”
Related Stories
Market Data | Sep 20, 2021
August construction employment lags pre-pandemic peak in 39 states
The coronavirus delta variant and supply problems hold back recovery.
Market Data | Sep 15, 2021
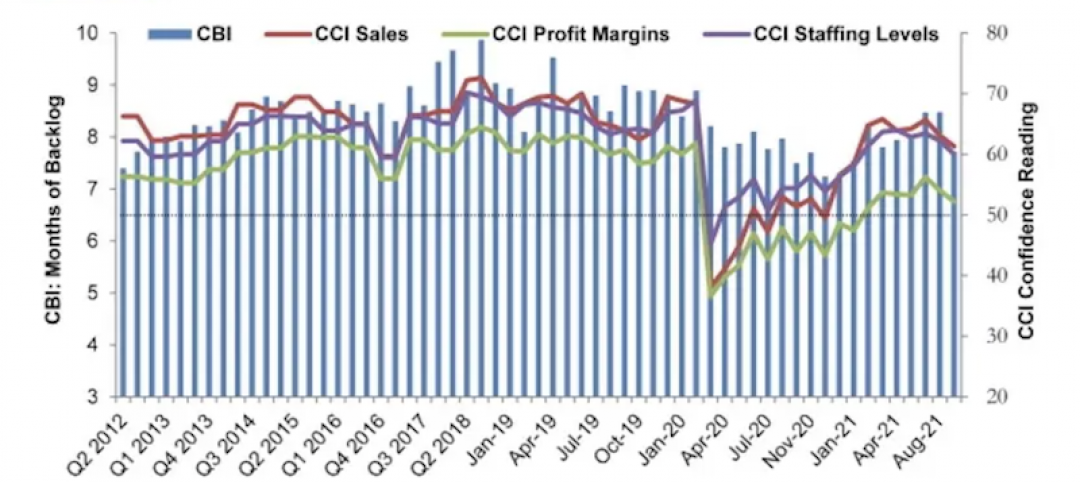
ABC’s Construction Backlog Indicator plummets in August; Contractor Confidence down
ABC’s Construction Confidence Index readings for sales, profit margins and staffing levels all fell modestly in August.
Market Data | Sep 7, 2021
Construction sheds 3,000 jobs in August
Gains are limited to homebuilding as other contractors struggle to fill both craft and salaried positions.
Market Data | Sep 3, 2021
Construction workforce shortages reach pre-pandemic levels
Coronavirus continues to impact projects and disrupt supply chains.

Multifamily Housing | Sep 1, 2021
Top 10 outdoor amenities at multifamily housing developments for 2021
Fire pits, lounge areas, and covered parking are the most common outdoor amenities at multifamily housing developments, according to new research from Multifamily Design+Construction.

Market Data | Sep 1, 2021
Construction spending posts small increase in July
Coronavirus, soaring costs, and supply disruptions threaten to erase further gains.
Market Data | Sep 1, 2021
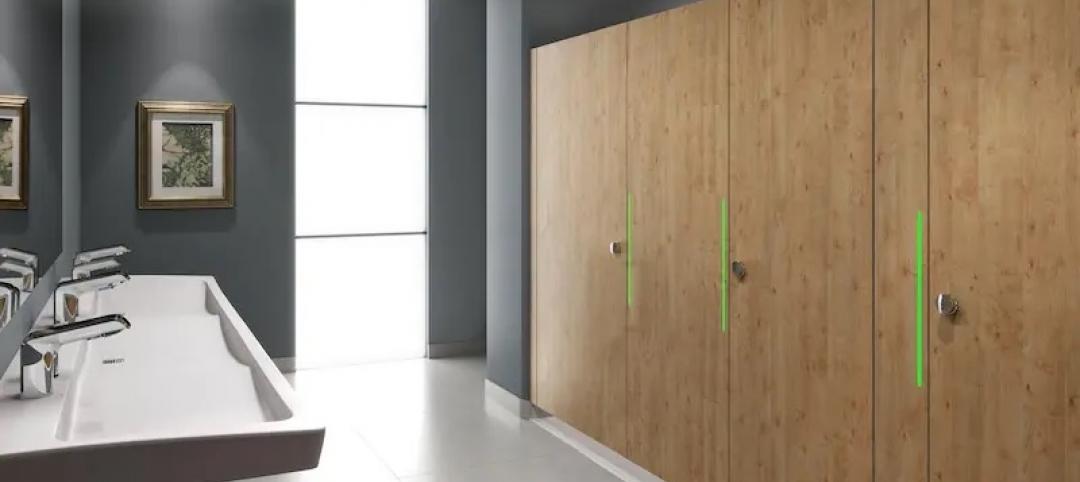
Bradley Corp. survey finds office workers taking coronavirus precautions
Due to the rise in new strains of the virus, 70% of office workers have implemented a more rigorous handwashing regimen versus 59% of the general population.
Market Data | Aug 31, 2021
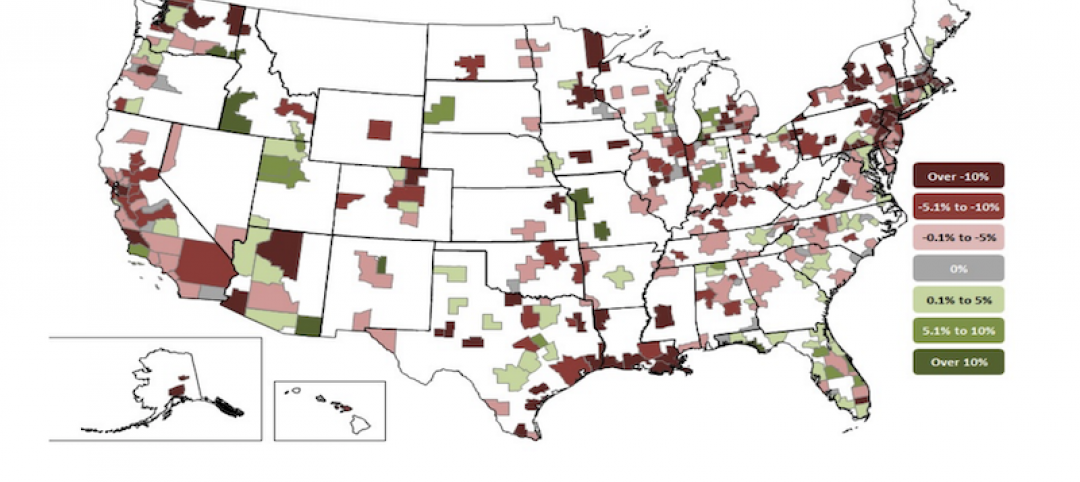
Three out of four metro areas add construction jobs from July 2020 to July 2021
COVID, rising costs, and supply chain woes may stall gains.
Market Data | Aug 24, 2021
July construction employment lags pre-pandemic peak in 36 states
Delta variant of coronavirus threatens to hold down further gains.
Market Data | Aug 17, 2021
Demand for design activity continues to expand
The ABI score for July was 54.6.


