


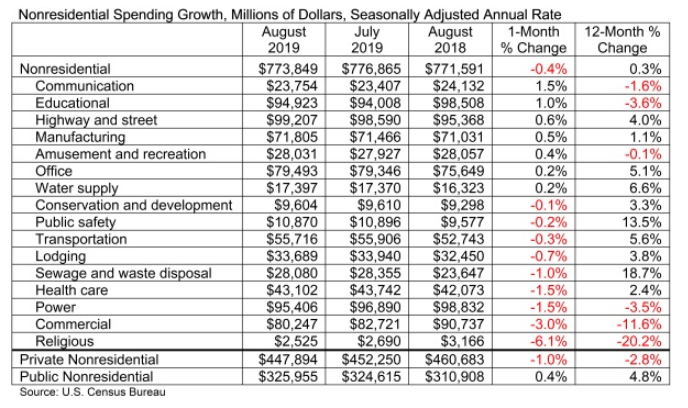
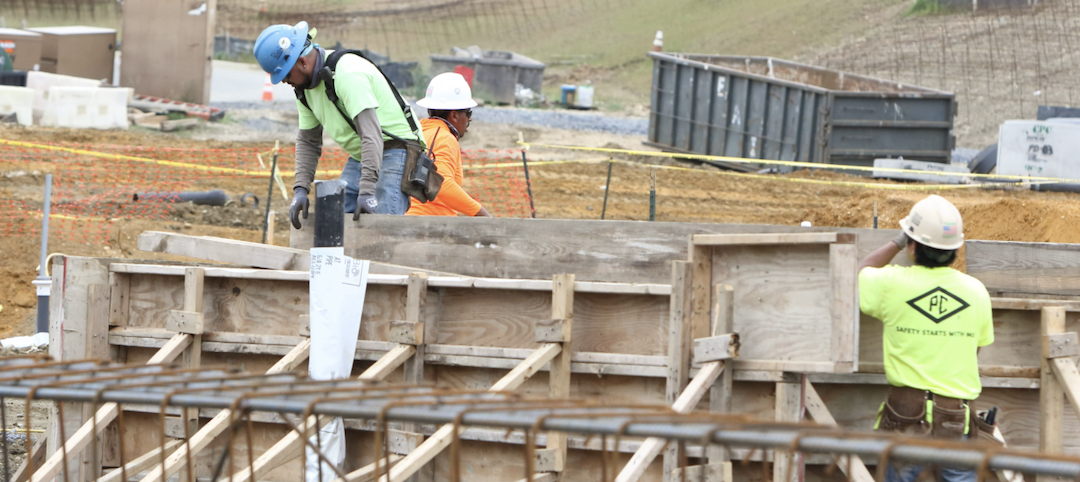
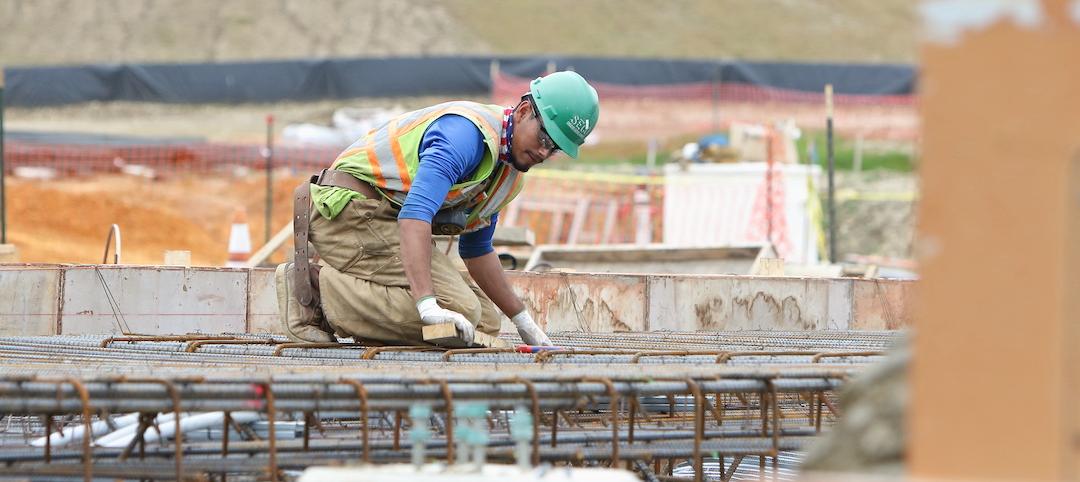
National nonresidential construction spending declined 0.4% in August, according to an Associated Builders and Contractors analysis of U.S. Census Bureau data published today. On a seasonally adjusted annualized basis, spending totaled $773.8 billion, 0.3% higher than in August 2018.
Private nonresidential spending fell 1% on a monthly basis and is down 2.8% compared to the same time last year. Public nonresidential construction expanded 0.4% for the month and 4.8% for the year.
"Nonresidential construction spending is down nearly 3% from its peak in April 2019 due to declines in private construction,” said ABC Chief Economist Anirban Basu. "Construction spending in the commercial category, which encompasses retail space among other segments, is down nearly 12% on a year-over-year basis. Spending related to lodging, including new hotel construction, was down 0.7% for the month and is up less than 4% year over year. Spending in the power segment also decreased in August and is down 3.5% compared to the same time last year."
“All of this is consistent with a slowing economy, especially as measures such as industrial production and capacity utilization remain stagnant,” said Basu. “While this could be attributed to trade wars and a slowing global economy, construction dynamics are rarely so simple. Another likely explanation is that America’s growing shortage of skilled construction workers has driven up the cost of delivering construction services, even in the context of flat materials prices, resulting in more project owners delaying projects.
“On the other hand, public construction spending continues to rise,” said Basu. “Construction spending on public safety is up 13.5% on a year-over-year basis and spending in the sewage/waste disposal category is up nearly 19%. State and local governments continue to benefit from an economy that has pushed property tax, sales tax and income tax collections higher. Low borrowing costs also serve as an inducement to leverage revenues with debt, resulting in more infrastructure spending. Given the recent path of interest rates, this dynamic should continue into 2020.”
Related Stories

Market Data | Nov 22, 2021
Only 16 states and D.C. added construction jobs since the pandemic began
Texas, Wyoming have worst job losses since February 2020, while Utah, South Dakota add the most.
Market Data | Nov 10, 2021
Construction input prices see largest monthly increase since June
Construction input prices are 21.1% higher than in October 2020.
Market Data | Nov 9, 2021
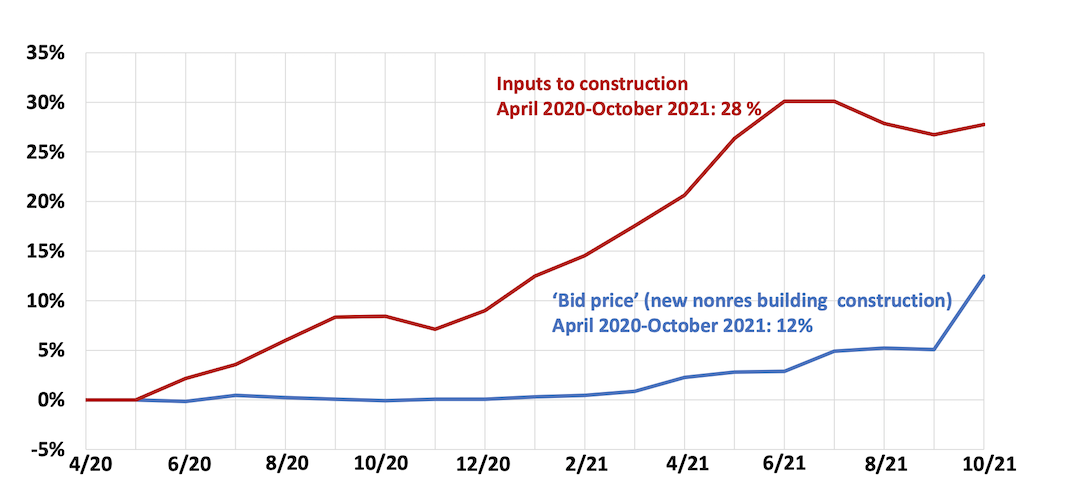
Continued increases in construction materials prices starting to drive up price of construction projects
Supply chain and labor woes continue.
Market Data | Nov 5, 2021
Construction firms add 44,000 jobs in October
Gain occurs even as firms struggle with supply chain challenges.
Market Data | Nov 3, 2021
One-fifth of metro areas lost construction jobs between September 2020 and 2021
Beaumont-Port Arthur, Texas and Sacramento--Roseville--Arden-Arcade Calif. top lists of gainers.
Market Data | Nov 2, 2021
Construction spending slumps in September
A drop in residential work projects adds to ongoing downturn in private and public nonresidential.
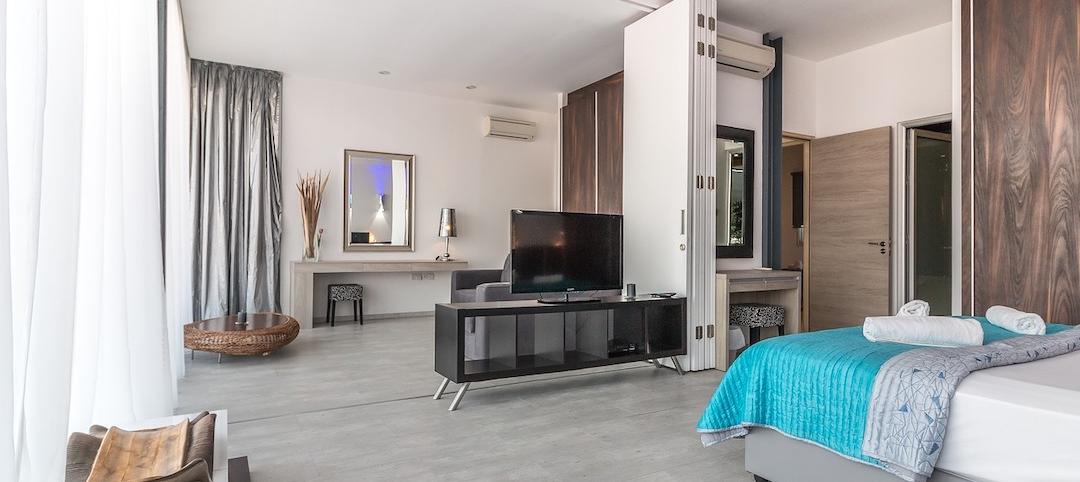
Hotel Facilities | Oct 28, 2021
Marriott leads with the largest U.S. hotel construction pipeline at Q3 2021 close
In the third quarter alone, Marriott opened 60 new hotels/7,882 rooms accounting for 30% of all new hotel rooms that opened in the U.S.
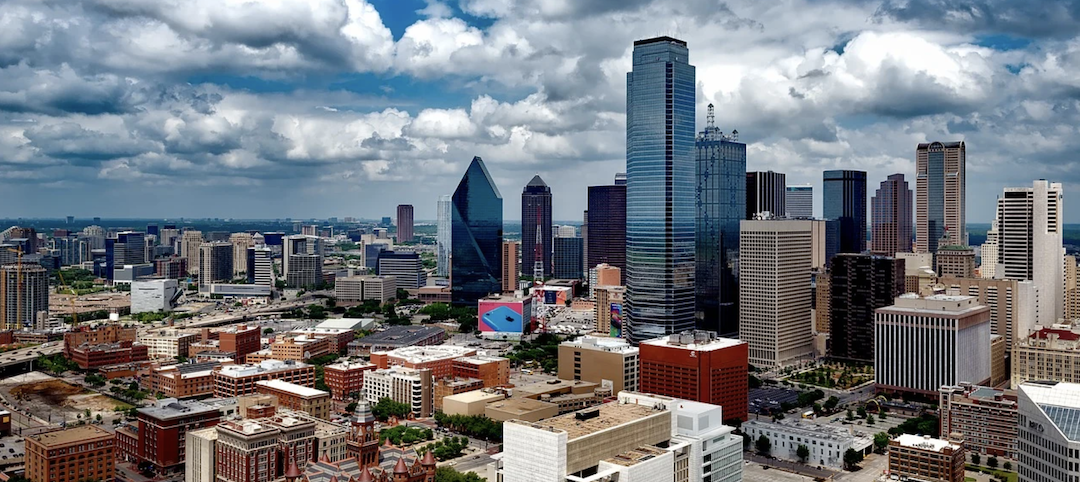
Hotel Facilities | Oct 28, 2021
At the end of Q3 2021, Dallas tops the U.S. hotel construction pipeline
The top 25 U.S. markets account for 33% of all pipeline projects and 37% of all rooms in the U.S. hotel construction pipeline.
Market Data | Oct 27, 2021
Only 14 states and D.C. added construction jobs since the pandemic began
Supply problems, lack of infrastructure bill undermine recovery.
Market Data | Oct 26, 2021
U.S. construction pipeline experiences highs and lows in the third quarter
Renovation and conversion pipeline activity remains steady at the end of Q3 ‘21, with conversion projects hitting a cyclical peak, and ending the quarter at 752 projects/79,024 rooms.


