

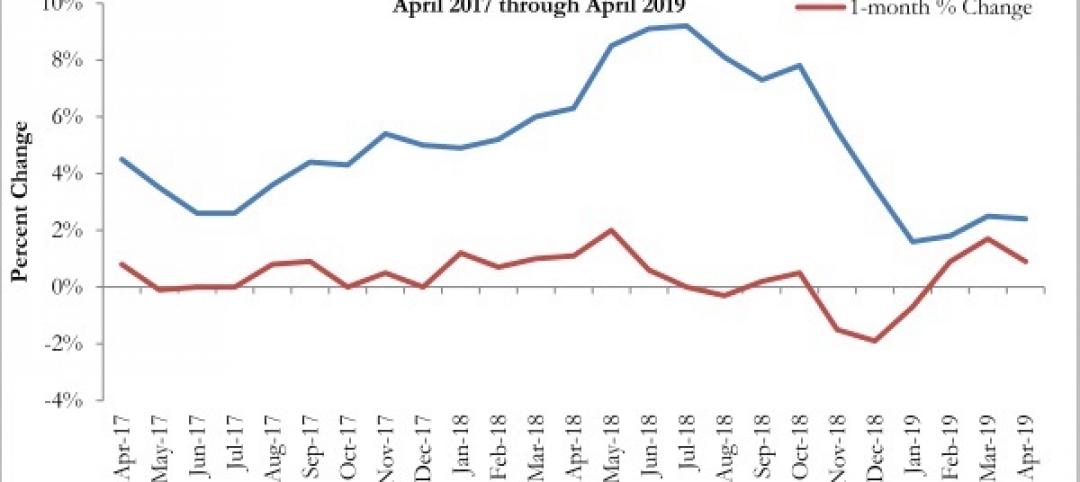
Following a sizable decrease in demand for design services in March, the April Architecture Billings Index (ABI) climbed back into positive territory according to a new report today from The American Institute of Architects (AIA).
AIA’s ABI score for April showed a small increase in design services at 50.5 in April, which is up from 47.8 in March. Any score above 50 indicates an increase in billings. Additionally, business conditions remained strong at firms located in the South. Despite this and the positive overall billings score, most regional and sector indictors continue to display decreasing demand for design services.
“In contrast to 2018, conditions throughout the construction sector recently have become more unsettled,” said AIA Chief Economist Kermit Baker, PhD, Hon. AIA. “Though we may not be at a critical inflection point, the next several months of billing data will be indicative of the health of the industry going into 2020.”
Key ABI highlights for April include:
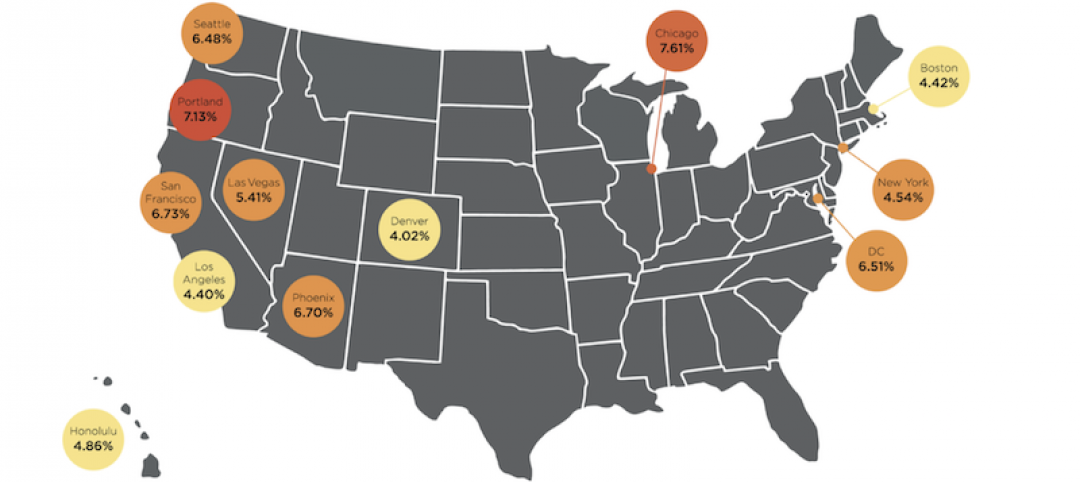
— Regional averages: South (51.6); Midwest (49.3); West (49.0); Northeast (45.1)
— Sector index breakdown: mixed practice (53.2); institutional (49.2); multi-family residential (47.4); commercial/industrial (46.6)
— Project inquiries index: 60.9
— Design contracts index: 52.1
The regional and sector categories are calculated as a three-month moving average, whereas the national index, design contracts and inquiries are monthly numbers.
Related Stories
Market Data | Jun 12, 2019
Construction input prices see slight increase in May
Among the 11 subcategories, six saw prices fall last month, with the largest decreases in natural gas.

Market Data | Jun 3, 2019
Nonresidential construction spending up 6.4% year over year in April
Among the 16 sectors tracked by the U.S. Census Bureau, nine experienced an increase in monthly spending, led by water supply and highway and street.

Market Data | Jun 3, 2019
4.1% annual growth in office asking rents above five-year compound annual growth rate
Market has experienced no change in office vacancy rates in three quarters.

Market Data | May 30, 2019
Construction employment increases in 250 out of 358 metros from April 2018 to April 2019
Demand for work is outpacing the supply of workers.
Market Data | May 24, 2019
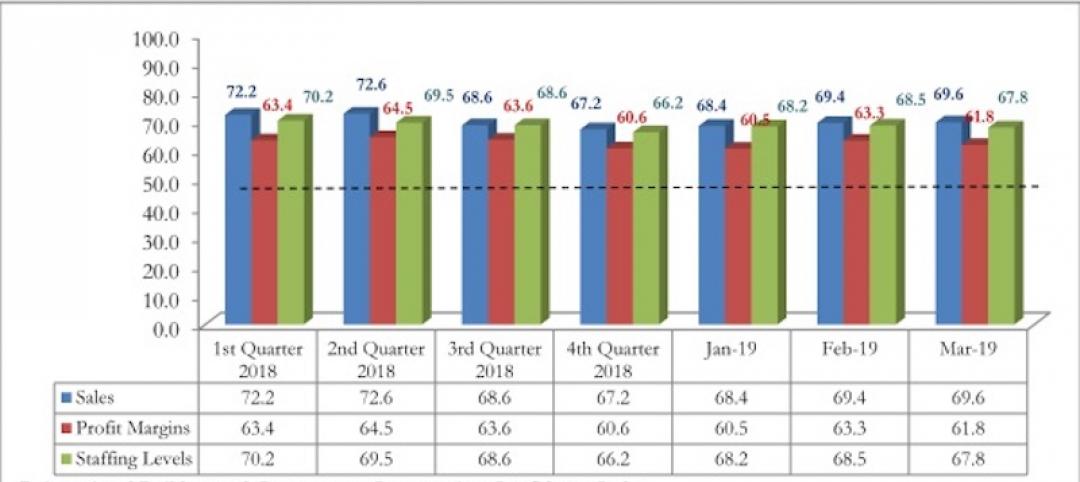
Construction contractors confidence remains high in March
More than 70% of contractors expect to increase staffing levels over the next six months.

Market Data | May 9, 2019
The U.S. hotel construction pipeline continues to grow in the first quarter as the economy shows surprising strength
Projects currently under construction stand at 1,709 projects/227,924 rooms.
Market Data | May 9, 2019
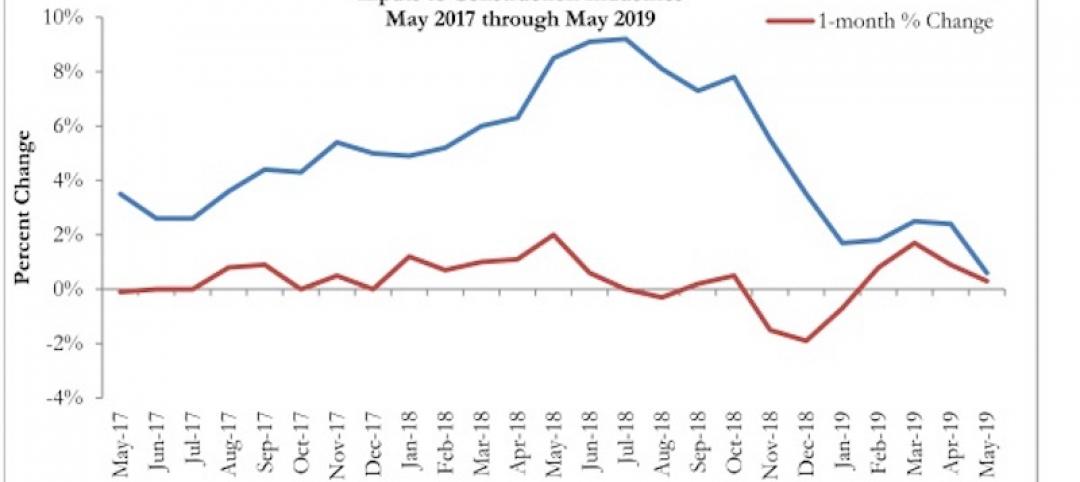
Construction input prices continue to rise
Nonresidential input prices rose 0.9% compared to March and are up 2.8% on an annual basis.
Market Data | May 7, 2019
Construction costs in major metros continued to climb last year
Latest Rider Levett Bucknall report estimates rise at more than double the rate of 2018 Growth Domestic Product.
Market Data | Apr 29, 2019
U.S. economic growth crosses 3% threshold to begin the year
Growth was fueled by myriad factors, including personal consumption expenditures, private inventory investment, surprisingly rapid growth in exports, state and local government spending and intellectual property.

Market Data | Apr 18, 2019
ABC report: 'Confidence seems to be making a comeback in America'
The Construction Confidence Index remained strong in February, according to the Associated Builders and Contractors.


