

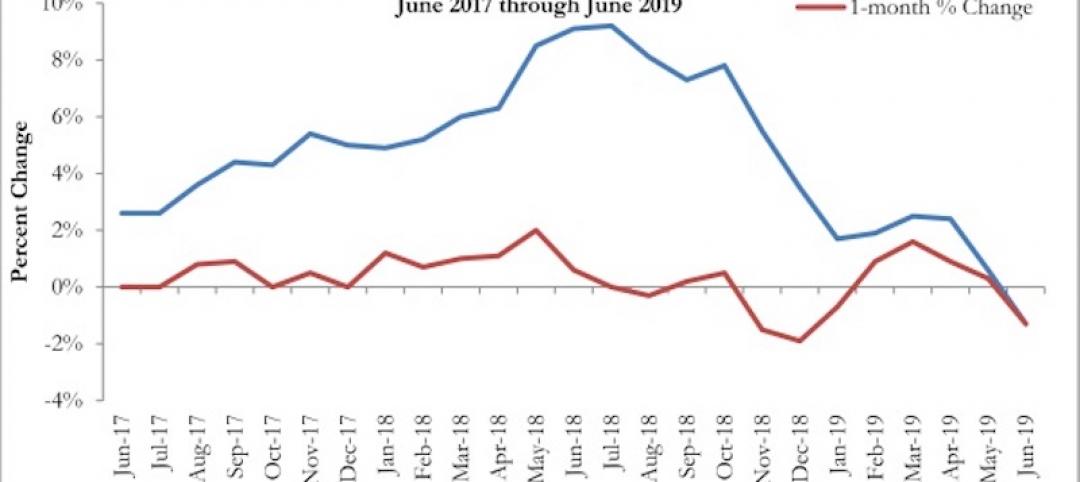
Following a sizable decrease in demand for design services in March, the April Architecture Billings Index (ABI) climbed back into positive territory according to a new report today from The American Institute of Architects (AIA).
AIA’s ABI score for April showed a small increase in design services at 50.5 in April, which is up from 47.8 in March. Any score above 50 indicates an increase in billings. Additionally, business conditions remained strong at firms located in the South. Despite this and the positive overall billings score, most regional and sector indictors continue to display decreasing demand for design services.
“In contrast to 2018, conditions throughout the construction sector recently have become more unsettled,” said AIA Chief Economist Kermit Baker, PhD, Hon. AIA. “Though we may not be at a critical inflection point, the next several months of billing data will be indicative of the health of the industry going into 2020.”
Key ABI highlights for April include:
— Regional averages: South (51.6); Midwest (49.3); West (49.0); Northeast (45.1)
— Sector index breakdown: mixed practice (53.2); institutional (49.2); multi-family residential (47.4); commercial/industrial (46.6)
— Project inquiries index: 60.9
— Design contracts index: 52.1
The regional and sector categories are calculated as a three-month moving average, whereas the national index, design contracts and inquiries are monthly numbers.
Related Stories

Market Data | Jul 20, 2019
Construction costs continued to rise in second quarter
Labor availability is a big factor in that inflation, according to Rider Levett Bucknall report.
Market Data | Jul 18, 2019
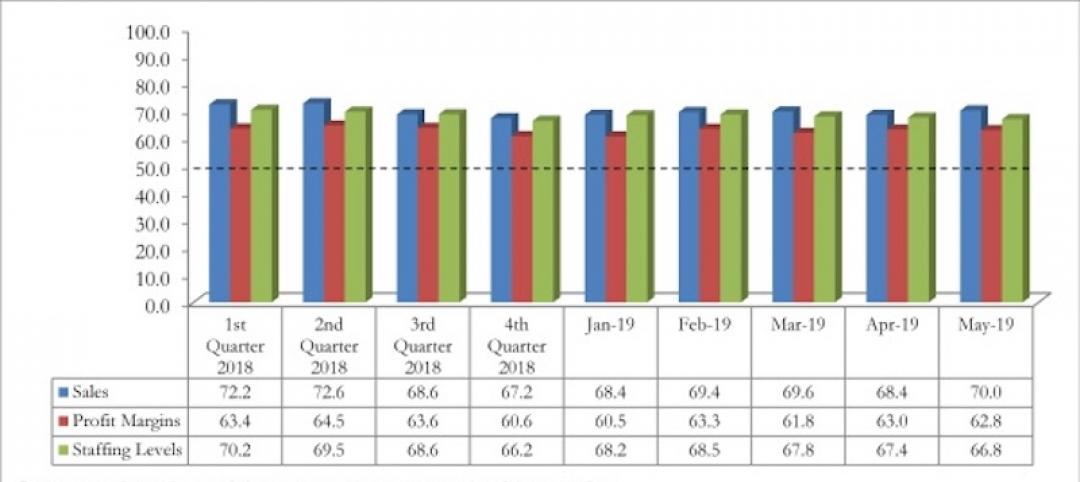
Construction contractors remain confident as summer begins
Contractors were slightly less upbeat regarding profit margins and staffing levels compared to April.
Market Data | Jul 17, 2019
Design services demand stalled in June
Project inquiry gains hit a 10-year low.
Market Data | Jul 16, 2019
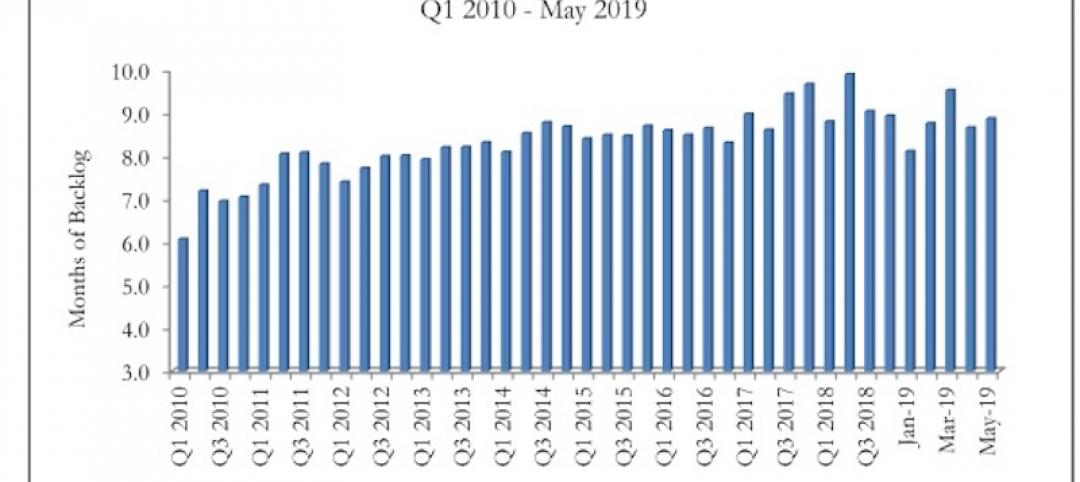
ABC’s Construction Backlog Indicator increases modestly in May
The Construction Backlog Indicator expanded to 8.9 months in May 2019.

K-12 Schools | Jul 15, 2019
Summer assignments: 2019 K-12 school construction costs
Using RSMeans data from Gordian, here are the most recent costs per square foot for K-12 school buildings in 10 cities across the U.S.
Market Data | Jul 12, 2019
Construction input prices plummet in June
This is the first time in nearly three years that input prices have fallen on a year-over-year basis.
Market Data | Jul 1, 2019
Nonresidential construction spending slips modestly in May
Among the 16 nonresidential construction spending categories tracked by the Census Bureau, five experienced increases in monthly spending.

Market Data | Jul 1, 2019
Almost 60% of the U.S. construction project pipeline value is concentrated in 10 major states
With a total of 1,302 projects worth $524.6 billion, California has both the largest number and value of projects in the U.S. construction project pipeline.
Market Data | Jun 21, 2019
Architecture billings remain flat
AIA’s Architecture Billings Index (ABI) score for May showed a small increase in design services at 50.2.

Market Data | Jun 19, 2019
Number of U.S. architects continues to rise
New data from NCARB reveals that the number of architects continues to increase.


