


In 2009, we met with Senior Facility Managers of four U.S. national laboratories to discuss a major limitation in the way they summarized their capital needs. As with most large organizations, they expressed capital needs in terms of deferred maintenance projects—things that needed to be fixed as determined by condition assessment (inspection or prescribed schedule). To put these needs in perspective, they computed a facility condition index (FCI), which is the ratio of deferred maintenance (D.M) costs to the replacement value of a building or portfolio.
Several years later, following the acquisition of Whitestone Research by CBRE Inc., it quickly became clear that major healthcare organizations around the world oftentimes employ a similar FCI based approach to their capital planning and prioritization decisions.
FACILITY CONDITION INDEX BREAKDOWN
According to a well-known scale developed initially for educational facilities in 1991, a facility is considered in poor condition if its FCI exceeds 90%. The shortcomings of the FCI approach are well-known, as results are not easily compared with alternative condition assessment approaches, and it does not contemplate methodologies for determining replacement values. These choices can become highly political for an organization that uses, as many do, the FCI as a key policy metric.
The basic concern of the laboratory facility managers was that the FCI did not represent the true condition of the facility in terms of safety, security, mission relevance, and other criteria that actually guide their decisions. FCI is also not a forecast or leading indicator that demonstrates consequences of alternative actions. These concerns led to a series of small projects that would eventually define a new approach to summarizing facility condition and prioritizing capital expenditures.
The new method, Risk Scanning, meets three requirements identified in our original meeting. The process must not rely on expensive inspections, must incorporate multiple (customizable) criteria, and the outcomes must be expressed as a simple monetary value.
This approach has universal applicability for laboratories and for large, corporate occupiers. In addition, we have found this approach to be particularly relevant for healthcare organizations today, given the extraordinary economic and regulatory pressures that have become a reality for the industry.
RISK SCANNING
Risk Scanning assumes that buildings or other assets can be reduced to an inventory of components (roof, HVAC equipment, plumbing fixtures, etc.). Each component has a “survivor” curve that relates its age to the likelihood of its failure in the future, little different than an actuarial calculation for an insurance policy. And each component, should it fail, could have consequences for the building operation. Below, Figure 1 illustrates how this data could be used as a simple sort by probability of failure, consequence of failure, or replacement cost.
Figure 1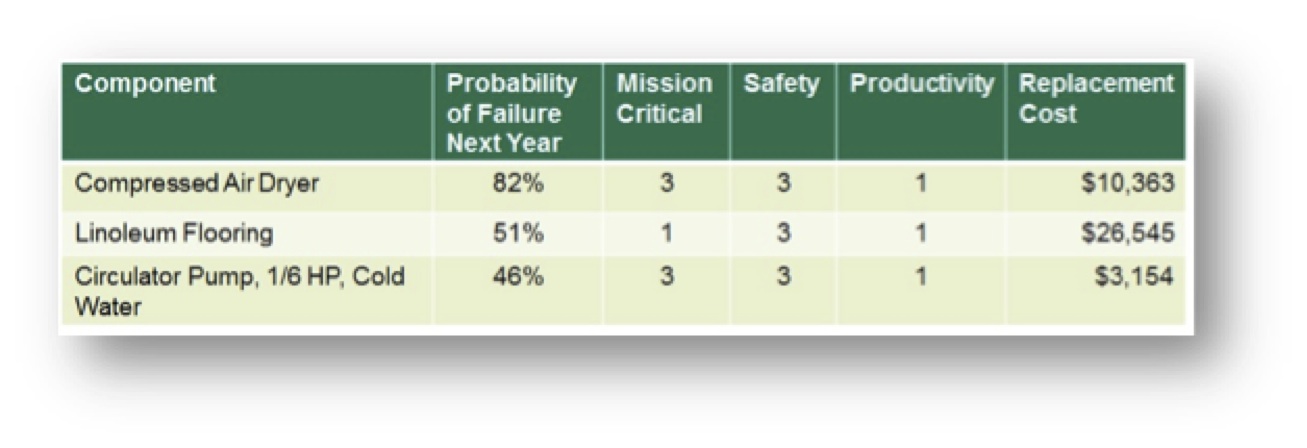
A more useful view of this data combines knowledge of the probability of failure and the potential consequences as the Risk Facility Managers implicitly consider when scheduling repairs. For example, a new light bulb in a closet would be low risk (low likelihood of failure, low impact on safety, security, mission, etc.), while a roof or electrical panel, far beyond their expected service life would be a high risk. Individual component risk ratings can be aggregated into risk maps by building, consequence type, or aggregated at the portfolio level.
Another example is a risk scan of a data center built in 1980, as shown in Figure 2. Risk is summarized by three consequences or threats of failure – mission, productivity and safety. The “Loss Intensity” is the measure (low, medium, high) of the impact of failure. Each cell in the tables is the sum of the replacement value of each component. For instance, in the first table there are high risk (red) components with replacement values totaling $374,210.
Figure 2: Dashboard showing risk by consequence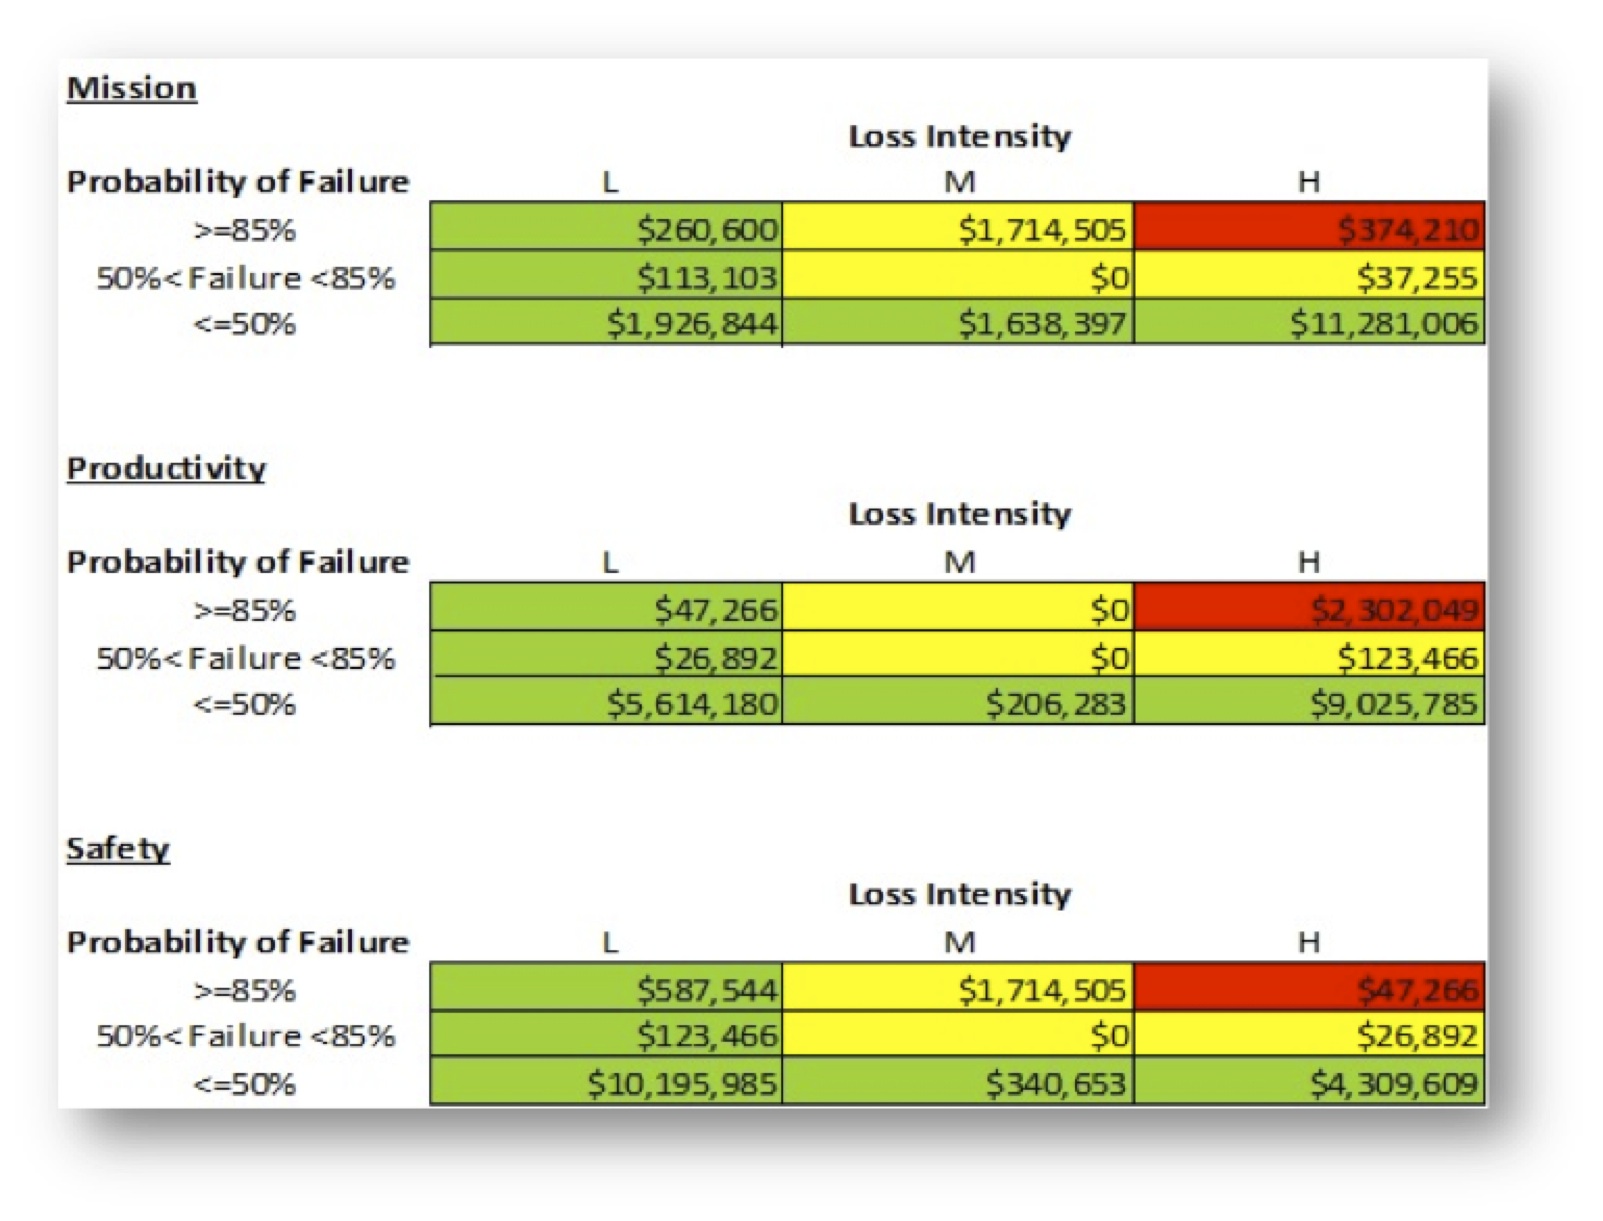
One way to represent overall risk is to sum across the individual tables in Figure 2, by risk category (red = high, yellow = moderate, green = low) to produce a single risk column, as shown in Figure 3. This shows that the costs to replace components rated high risk in 2015 for any reason (mission, productivity, or safety) were $2,349,315. Note that some components are high risk for multiple reasons.
Figure 3: Risk Column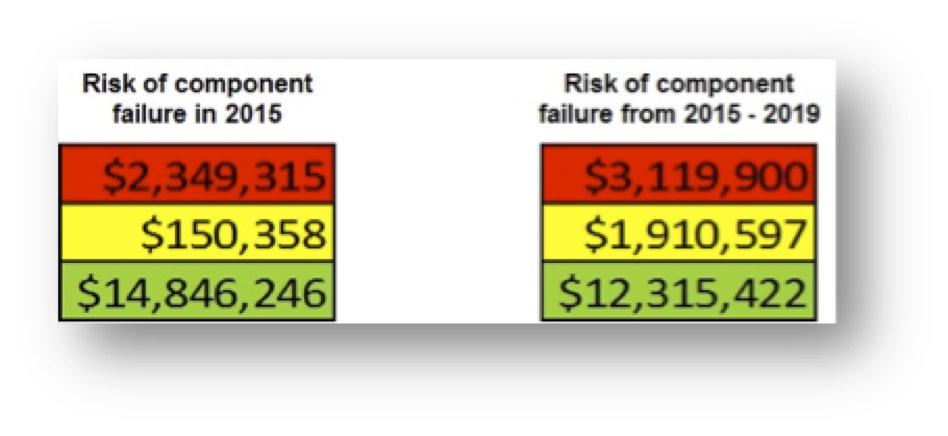
The calculation of the column can be modified for different purposes. The ratings from the dashboard could be weighted to reflect management priorities. The likelihood of failure, and consequent migration of risk ratings, could be estimated for a range of years, as shown for the period 2015-2019.
COMPARING THE FCI WITH RISK SCANNING
The data center example provides a useful comparison of the output from a simple condition assessment with the additional data provided by Risk Scanning.
A conventional facility condition assessment using a life cycle cost model indicated that 75 components had exceeded their service life. The costs of replacing these would be $4,771,159. Considering this amount to be deferred maintenance (D.M.), the FCI would be 5% (given $100 million replacement value). This would be summarized as a building in “fair” condition.
Figure 4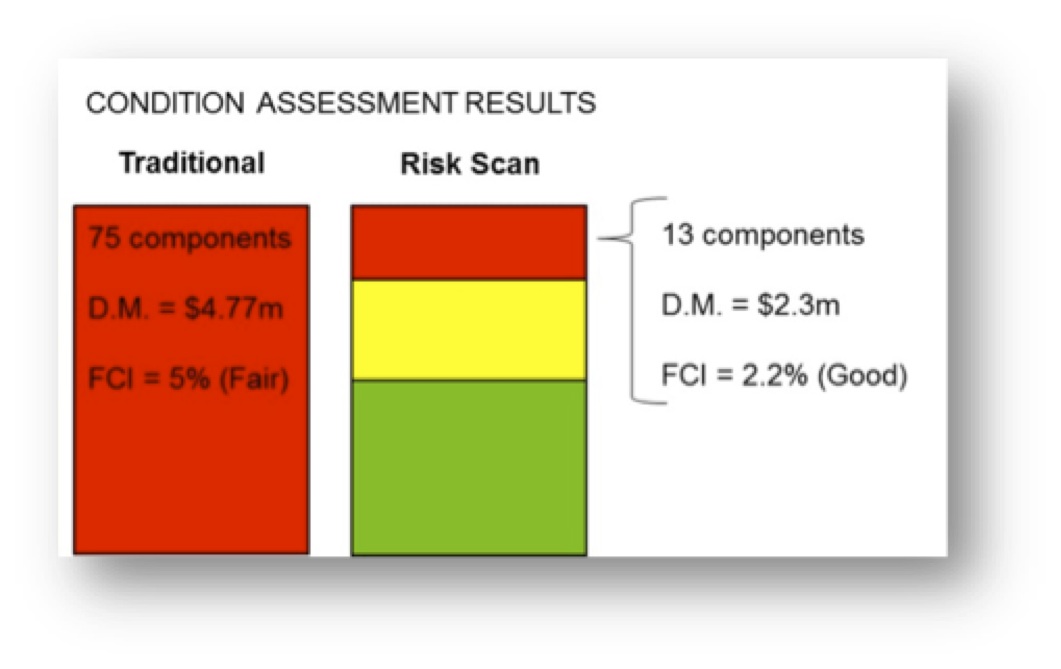
A Risk Scan of the component inventory indicates that 13 components are at high risk, and the costs of replacing these would be $2,349,315. This is less than half the costs of replacements by a simple service life-assessment. An FCI based on high risk components would be 2.2%, indicating a building in “good” condition.
In this case, with the additional information provided by Risk Scanning, the facility would be considered in better condition than with the simple condition assessment. Moreover, the risk scan would provide a rating for all components—including those not yet considered as deferred maintenance—as a basis for anticipating future needs and prioritization.
CONCLUSION
The Risk Scanning approach uses well-known risk analytics applied to pre-existing facility data to provide a richer view of facility condition more consistent with actual management decision making. In practice, limited funding is directed to those repairs and replacements that address corporate priorities, such as safety, security, and mission achievement. For healthcare systems, this approach can provide critical insight for decision-making about capital deployment where actionable criteria are not established or where data is limited.
About the Authors
Peter Lufkin is Senior Managing Director and Luca Romani is Senior Analyst with CBRE Whitestone.
Related Stories

Affordable Housing | Apr 1, 2024
Chicago voters nix ‘mansion tax’ to fund efforts to reduce homelessness
Chicago voters in March rejected a proposed “mansion tax” that would have funded efforts to reduce homelessness in the city.

Standards | Apr 1, 2024
New technical bulletin covers window opening control devices
A new technical bulletin clarifies the definition of a window opening control device (WOCD) to promote greater understanding of the role of WOCDs and provide an understanding of a WOCD’s function.

Adaptive Reuse | Mar 30, 2024
Hotel vs. office: Different challenges in commercial to residential conversions
In the midst of a national housing shortage, developers are examining the viability of commercial to residential conversions as a solution to both problems.

Sustainability | Mar 29, 2024
Demystifying carbon offsets vs direct reductions
Chris Forney, Principal, Brightworks Sustainability, and Rob Atkinson, Senior Project Manager, IA Interior Architects, share the misconceptions about carbon offsets and identify opportunities for realizing a carbon-neutral building portfolio.

Reconstruction & Renovation | Mar 28, 2024
Longwood Gardens reimagines its horticulture experience with 17-acre conservatory
Longwood Gardens announced this week that Longwood Reimagined: A New Garden Experience, the most ambitious revitalization in a century of America’s greatest center for horticultural display, will open to the public on November 22, 2024.

Office Buildings | Mar 27, 2024
A new Singapore office campus inaugurates the Jurong Innovation District, a business park located in a tropical rainforest
Surbana Jurong, an urban, infrastructure and managed services consulting firm, recently opened its new headquarters in Singapore. Surbana Jurong Campus inaugurates the Jurong Innovation District, a business park set in a tropical rainforest.

Cultural Facilities | Mar 27, 2024
Kansas City’s new Sobela Ocean Aquarium home to nearly 8,000 animals in 34 habitats
Kansas City’s new Sobela Ocean Aquarium is a world-class facility home to nearly 8,000 animals in 34 habitats ranging from small tanks to a giant 400,000-gallon shark tank.

Market Data | Mar 26, 2024
Architecture firm billings see modest easing in February
Architecture firm billings continued to decline in February, with an AIA/Deltek Architecture Billings Index (ABI) score of 49.5 for the month. However, February’s score marks the most modest easing in billings since July 2023 and suggests that the recent slowdown may be receding.

Cultural Facilities | Mar 26, 2024
Renovation restores century-old Brooklyn Paramount Theater to its original use
The renovation of the iconic Brooklyn Paramount Theater restored the building to its original purpose as a movie theater and music performance venue. Long Island University had acquired the venue in the 1960s and repurposed it as the school’s basketball court.

Adaptive Reuse | Mar 26, 2024
Adaptive Reuse Scorecard released to help developers assess project viability
Lamar Johnson Collaborative announced the debut of the firm’s Adaptive Reuse Scorecard, a proprietary methodology to quickly analyze the viability of converting buildings to other uses.


