

Nearly one-third of U.S. metro areas lost construction jobs between August 2020 and August 2021, according to an analysis by the Associated General Contractors of America of government employment data released today. Association officials noted that the job losses are occurring as the fate of a bipartisan infrastructure bill that would boost demand for construction remains uncertain in the U.S. House of Representatives.
“While construction activity has rebounded from pandemic lows in many metros, the recovery is fragile,” said Ken Simonson, the association’s chief economist. “Extreme production and delivery delays, along with continuing high materials costs, may lead to project cancellations and postponements that cut into job gains.”
Construction employment declined from a year earlier in 65 metros and held steady in 37. New York City lost the most jobs (-8,600 jobs or -6%), followed by Nassau County-Suffolk County, N.Y. (-5,100 jobs, -6%); Miami-Miami Beach-Kendall, Fla. (-3,200 jobs, -6%); Calvert-Charles-Prince George’s, Md. (-2,400 jobs, -7%) and Houston-The Woodlands-Sugar Land, Texas (-2,300 jobs, -1%). The largest percentage declines were in Evansville, Ind.-Ky. (-14%, -1,400 jobs); Tuscaloosa, Ala. (-12%, -800 jobs); Watertown-Fort Drum, N.Y. (-11%, -200 jobs); Morristown, Tenn. (-10%, -200 jobs); Victoria, Texas (-9%, -300 jobs) and Gadsden, Ala. (-9%, -100 jobs).
Construction employment increased in 256 out of 358 metro areas over the last 12 months. San Diego-Carlsbad, Calif. added the most construction jobs (8,900 jobs, 11%; followed by Sacramento-Roseville--Arden-
Association officials urged members of both parties in the House to vote for the bipartisan infrastructure bill, noting its new funding was needed to modernize the nation’s aging highways and transit systems. They noted the measure is slated for a vote this Thursday and cautioned that the industry was likely to lose more construction jobs without the measure.
“This is the kind of infrastructure bill that Democrats and Republicans have been promising to pass for years now,” said Stephen E. Sandherr, the association’s chief executive officer. “Failing to pass this measure will create new challenges for the economy.”
View the metro employment data, rankings, top 10, new highs and lows, and map.
Related Stories

Market Data | Dec 19, 2018
Run of positive billings continues at architecture firms
November marked the fourteenth consecutive month of increasing demand for architectural firm services.

Market Data | Dec 5, 2018
ABC predicts construction sector will remain strong in 2019
Job growth, high backlog and healthy infrastructure investment all spell good news for the industry.
Market Data | Dec 4, 2018
Nonresidential spending rises modestly in October
Thirteen out of 16 subsectors are associated with year-over-year increases.

Market Data | Nov 20, 2018
Construction employment rises from October 2017 to October 2018 in 44 states and D.C.
Texas has biggest annual job increase while New Jersey continues losses; Iowa, Florida and California have largest one-month gains as Mississippi and Louisiana trail.

Market Data | Nov 15, 2018
Architecture firm billings continue to slow, but remain positive in October
Southern region reports decline in billings for the first time since June 2012.

Market Data | Nov 14, 2018
A new Joint Center report finds aging Americans less prepared to afford housing
The study foresees a significant segment of seniors struggling to buy or rent on their own or with other people.

Market Data | Nov 12, 2018
Leading hotel markets in the U.S. construction pipeline
Projects already under construction and those scheduled to start construction in the next 12 months, combined, have a total of 3,782 projects/213,798 rooms and are at cyclical highs.

Market Data | Nov 6, 2018
Unflagging national office market enjoys economic tailwinds
Stable vacancy helped push asking rents 4% higher in third quarter.
Market Data | Nov 2, 2018
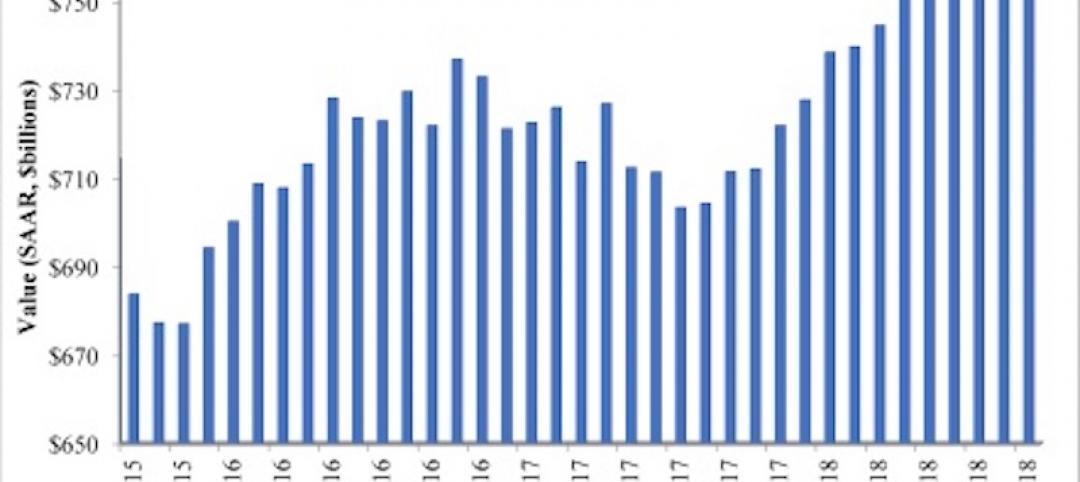
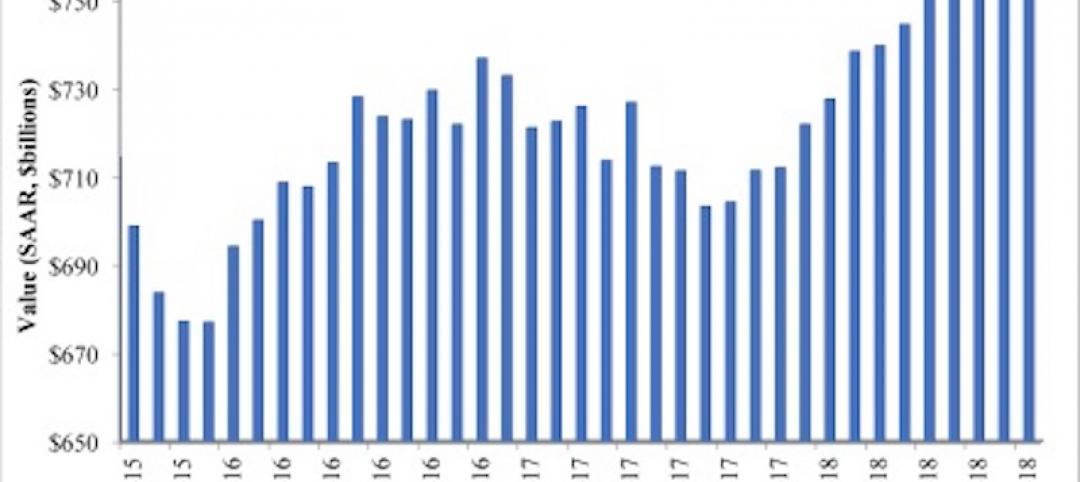
Nonresidential spending retains momentum in September, up 8.9% year over year
Total nonresidential spending stood at $767.1 billion on a seasonally adjusted, annualized rate in September.

Market Data | Oct 30, 2018
Construction projects planned and ongoing by world’s megacities valued at $4.2trn
The report states that Dubai tops the list with total project values amounting to US$374.2bn.


