

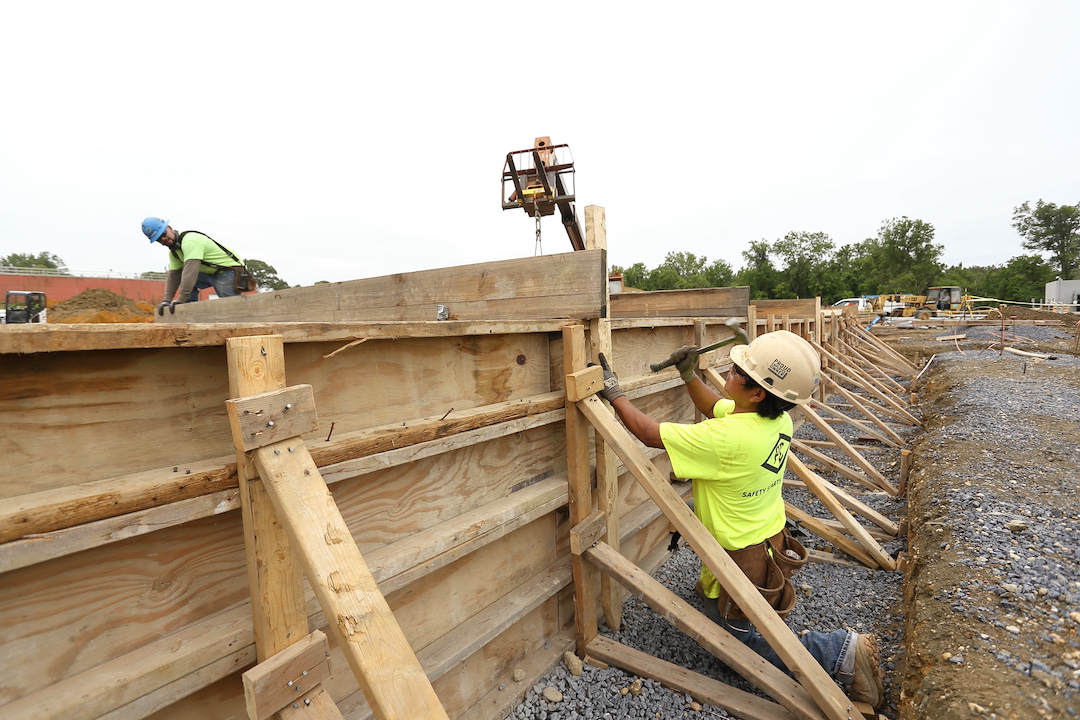
Nearly one-third of U.S. metro areas lost construction jobs between August 2020 and August 2021, according to an analysis by the Associated General Contractors of America of government employment data released today. Association officials noted that the job losses are occurring as the fate of a bipartisan infrastructure bill that would boost demand for construction remains uncertain in the U.S. House of Representatives.
“While construction activity has rebounded from pandemic lows in many metros, the recovery is fragile,” said Ken Simonson, the association’s chief economist. “Extreme production and delivery delays, along with continuing high materials costs, may lead to project cancellations and postponements that cut into job gains.”
Construction employment declined from a year earlier in 65 metros and held steady in 37. New York City lost the most jobs (-8,600 jobs or -6%), followed by Nassau County-Suffolk County, N.Y. (-5,100 jobs, -6%); Miami-Miami Beach-Kendall, Fla. (-3,200 jobs, -6%); Calvert-Charles-Prince George’s, Md. (-2,400 jobs, -7%) and Houston-The Woodlands-Sugar Land, Texas (-2,300 jobs, -1%). The largest percentage declines were in Evansville, Ind.-Ky. (-14%, -1,400 jobs); Tuscaloosa, Ala. (-12%, -800 jobs); Watertown-Fort Drum, N.Y. (-11%, -200 jobs); Morristown, Tenn. (-10%, -200 jobs); Victoria, Texas (-9%, -300 jobs) and Gadsden, Ala. (-9%, -100 jobs).
Construction employment increased in 256 out of 358 metro areas over the last 12 months. San Diego-Carlsbad, Calif. added the most construction jobs (8,900 jobs, 11%; followed by Sacramento-Roseville--Arden-
Association officials urged members of both parties in the House to vote for the bipartisan infrastructure bill, noting its new funding was needed to modernize the nation’s aging highways and transit systems. They noted the measure is slated for a vote this Thursday and cautioned that the industry was likely to lose more construction jobs without the measure.
“This is the kind of infrastructure bill that Democrats and Republicans have been promising to pass for years now,” said Stephen E. Sandherr, the association’s chief executive officer. “Failing to pass this measure will create new challenges for the economy.”
View the metro employment data, rankings, top 10, new highs and lows, and map.
Related Stories
Market Data | Aug 2, 2018
Nonresidential construction spending dips in June
“The hope is that June’s construction spending setback is merely a statistical aberration,” said ABC Chief Economist Anirban Basu.

Market Data | Aug 1, 2018
U.S. hotel construction pipeline continues moderate growth year-over-year
The hotel construction pipeline has been growing moderately and incrementally each quarter.
Market Data | Jul 30, 2018
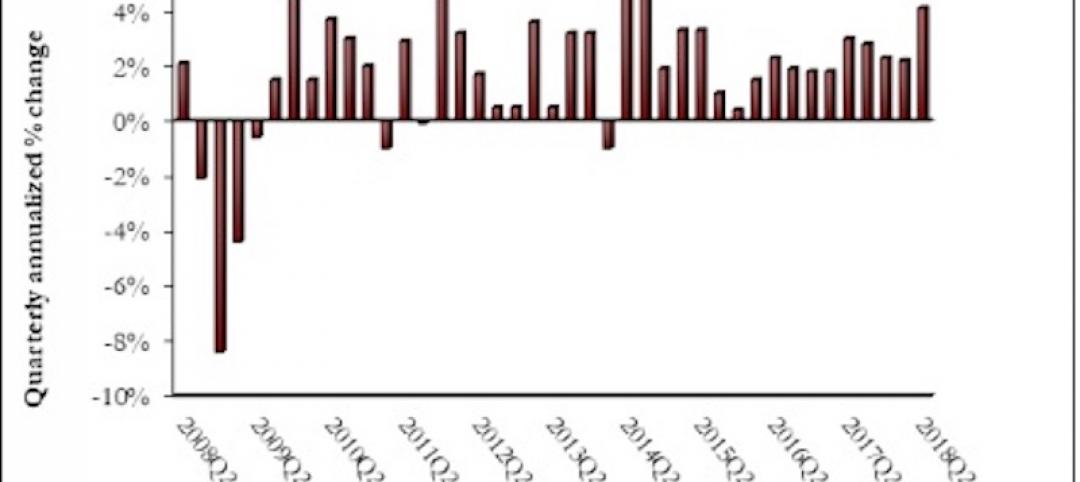
Nonresidential fixed investment surges in second quarter
Nonresidential fixed investment represented an especially important element of second quarter strength in the advance estimate.

Market Data | Jul 11, 2018
Construction material prices increase steadily in June
June represents the latest month associated with rapidly rising construction input prices.

Market Data | Jun 26, 2018
Yardi Matrix examines potential regional multifamily supply overload
Outsize development activity in some major metros could increase vacancy rates and stagnate rent growth.

Market Data | Jun 22, 2018
Multifamily market remains healthy – Can it be sustained?
New report says strong economic fundamentals outweigh headwinds.

Market Data | Jun 21, 2018
Architecture firm billings strengthen in May
Architecture Billings Index enters eighth straight month of solid growth.

Market Data | Jun 20, 2018
7% year-over-year growth in the global construction pipeline
There are 5,952 projects/1,115,288 rooms under construction, up 8% by projects YOY.
Market Data | Jun 19, 2018
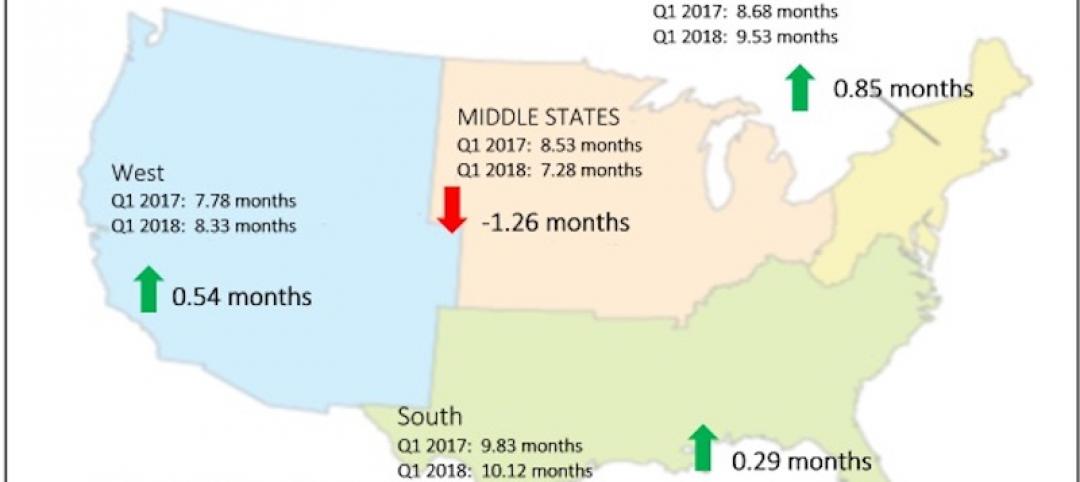
ABC’s Construction Backlog Indicator remains elevated in first quarter of 2018
The CBI shows highlights by region, industry, and company size.
Market Data | Jun 19, 2018
America’s housing market still falls short of providing affordable shelter to many
The latest report from the Joint Center for Housing Studies laments the paucity of subsidies to relieve cost burdens of ownership and renting.


