

Nearly one-third of U.S. metro areas lost construction jobs between August 2020 and August 2021, according to an analysis by the Associated General Contractors of America of government employment data released today. Association officials noted that the job losses are occurring as the fate of a bipartisan infrastructure bill that would boost demand for construction remains uncertain in the U.S. House of Representatives.
“While construction activity has rebounded from pandemic lows in many metros, the recovery is fragile,” said Ken Simonson, the association’s chief economist. “Extreme production and delivery delays, along with continuing high materials costs, may lead to project cancellations and postponements that cut into job gains.”
Construction employment declined from a year earlier in 65 metros and held steady in 37. New York City lost the most jobs (-8,600 jobs or -6%), followed by Nassau County-Suffolk County, N.Y. (-5,100 jobs, -6%); Miami-Miami Beach-Kendall, Fla. (-3,200 jobs, -6%); Calvert-Charles-Prince George’s, Md. (-2,400 jobs, -7%) and Houston-The Woodlands-Sugar Land, Texas (-2,300 jobs, -1%). The largest percentage declines were in Evansville, Ind.-Ky. (-14%, -1,400 jobs); Tuscaloosa, Ala. (-12%, -800 jobs); Watertown-Fort Drum, N.Y. (-11%, -200 jobs); Morristown, Tenn. (-10%, -200 jobs); Victoria, Texas (-9%, -300 jobs) and Gadsden, Ala. (-9%, -100 jobs).
Construction employment increased in 256 out of 358 metro areas over the last 12 months. San Diego-Carlsbad, Calif. added the most construction jobs (8,900 jobs, 11%; followed by Sacramento-Roseville--Arden-
Association officials urged members of both parties in the House to vote for the bipartisan infrastructure bill, noting its new funding was needed to modernize the nation’s aging highways and transit systems. They noted the measure is slated for a vote this Thursday and cautioned that the industry was likely to lose more construction jobs without the measure.
“This is the kind of infrastructure bill that Democrats and Republicans have been promising to pass for years now,” said Stephen E. Sandherr, the association’s chief executive officer. “Failing to pass this measure will create new challenges for the economy.”
View the metro employment data, rankings, top 10, new highs and lows, and map.
Related Stories
Market Data | Jul 18, 2019
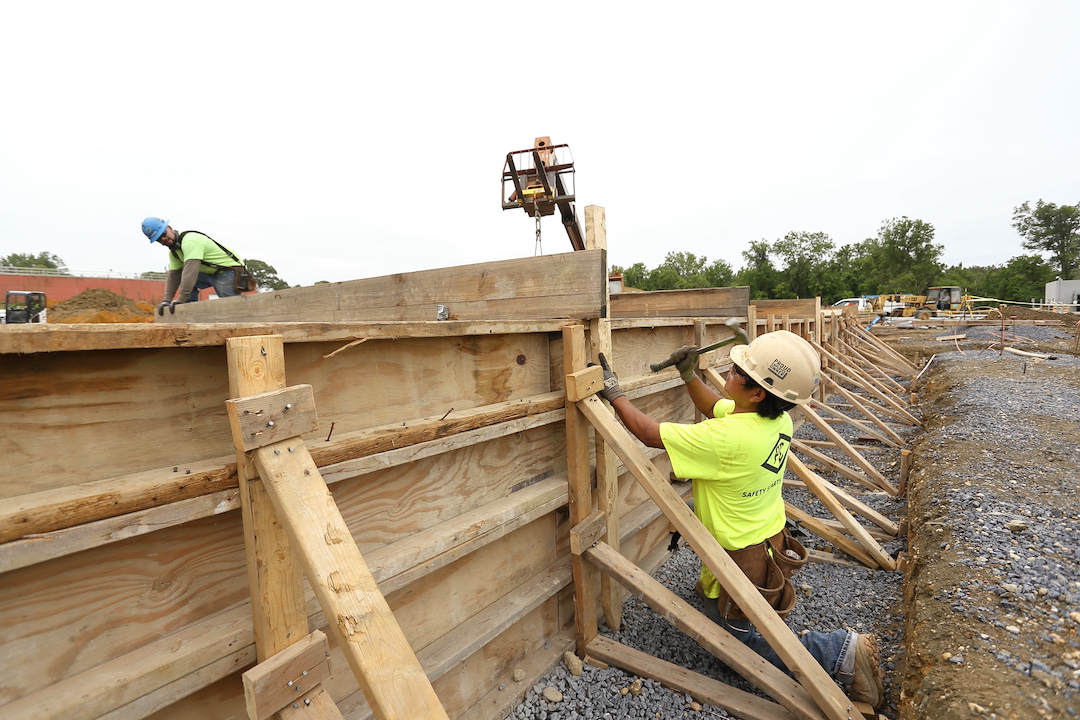
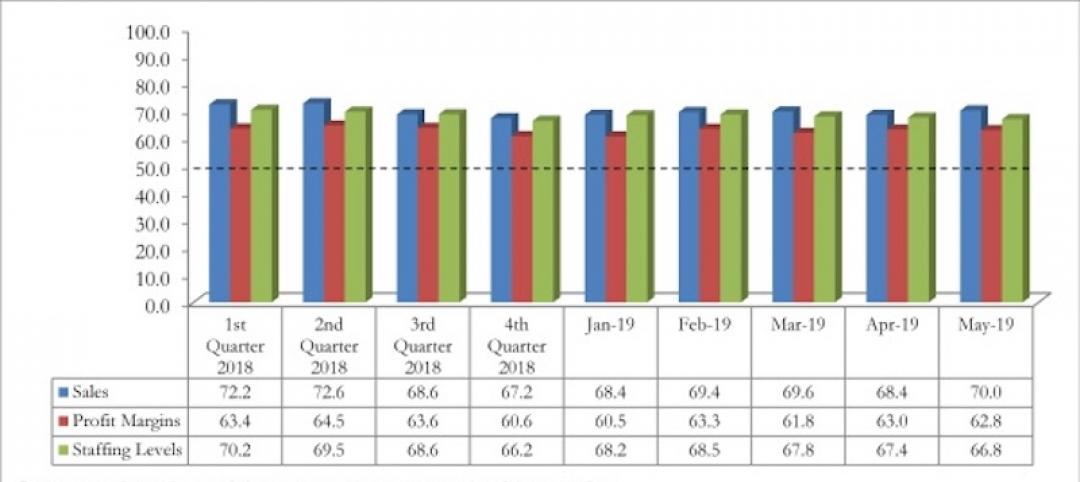
Construction contractors remain confident as summer begins
Contractors were slightly less upbeat regarding profit margins and staffing levels compared to April.
Market Data | Jul 17, 2019
Design services demand stalled in June
Project inquiry gains hit a 10-year low.
Market Data | Jul 16, 2019
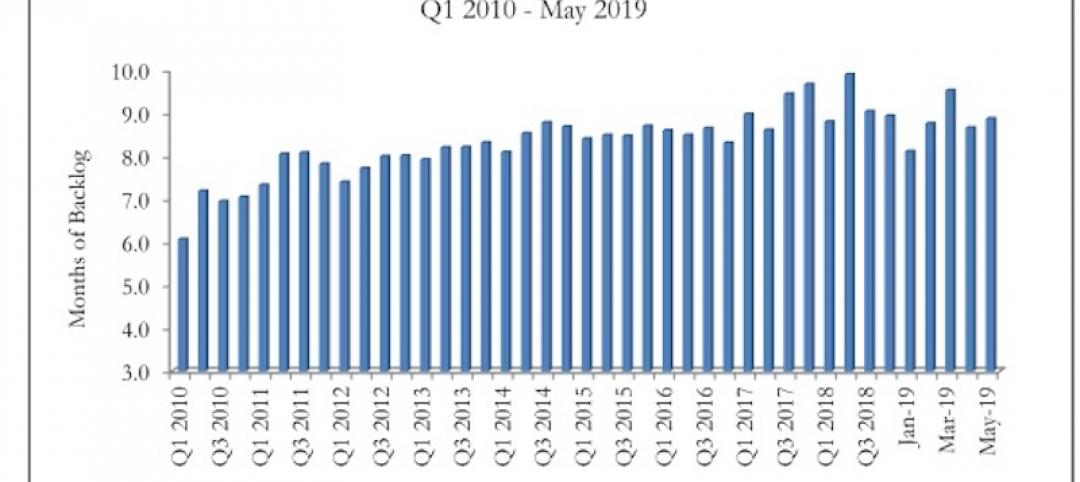
ABC’s Construction Backlog Indicator increases modestly in May
The Construction Backlog Indicator expanded to 8.9 months in May 2019.

K-12 Schools | Jul 15, 2019
Summer assignments: 2019 K-12 school construction costs
Using RSMeans data from Gordian, here are the most recent costs per square foot for K-12 school buildings in 10 cities across the U.S.
Market Data | Jul 12, 2019
Construction input prices plummet in June
This is the first time in nearly three years that input prices have fallen on a year-over-year basis.
Market Data | Jul 1, 2019
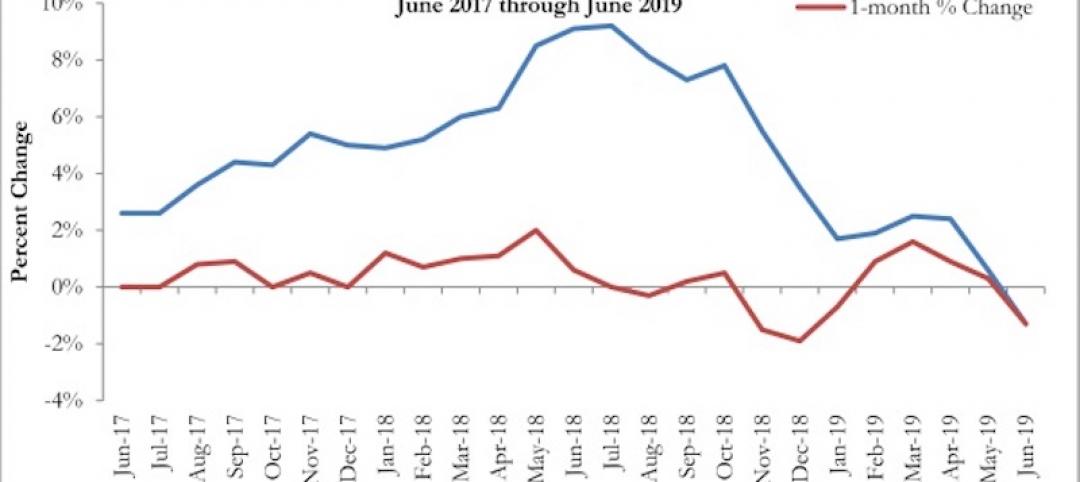
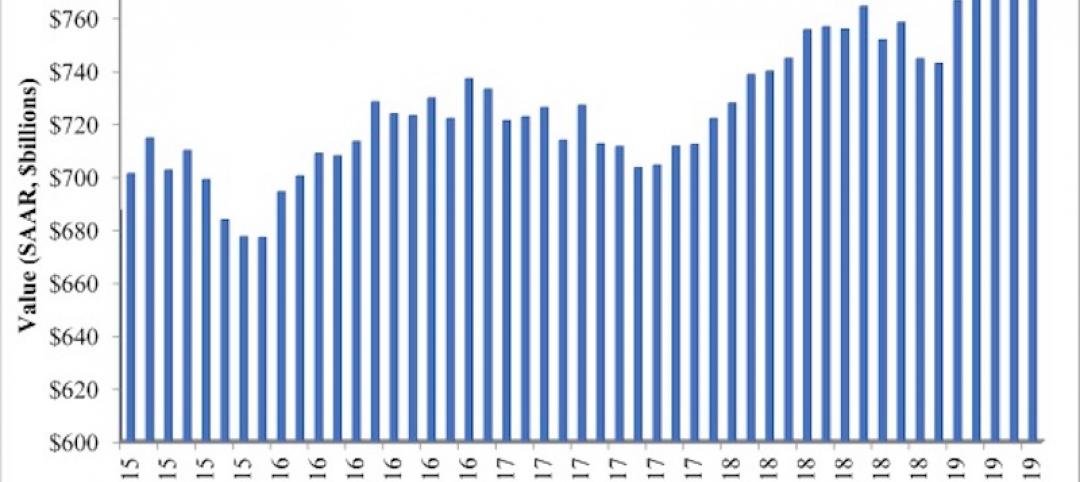
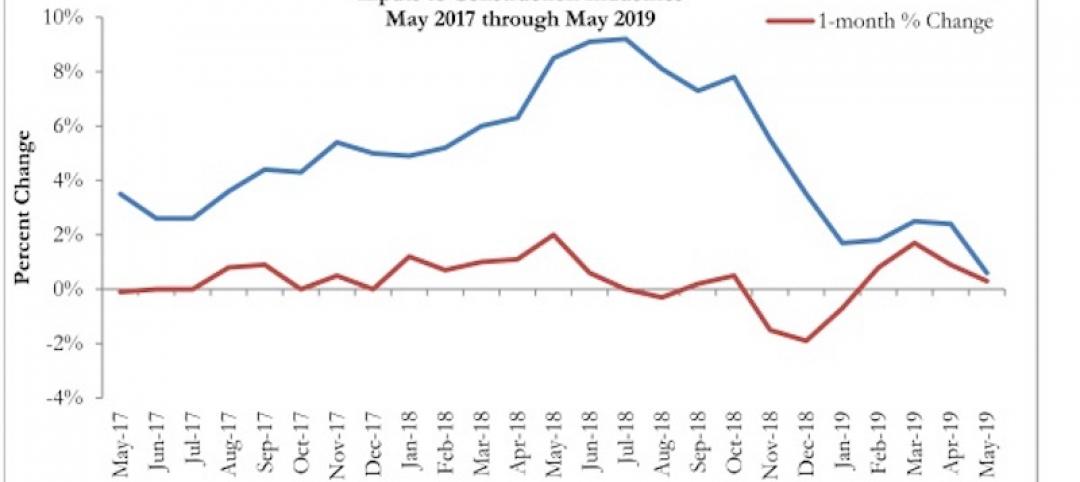
Nonresidential construction spending slips modestly in May
Among the 16 nonresidential construction spending categories tracked by the Census Bureau, five experienced increases in monthly spending.

Market Data | Jul 1, 2019
Almost 60% of the U.S. construction project pipeline value is concentrated in 10 major states
With a total of 1,302 projects worth $524.6 billion, California has both the largest number and value of projects in the U.S. construction project pipeline.

Market Data | Jun 21, 2019
Architecture billings remain flat
AIA’s Architecture Billings Index (ABI) score for May showed a small increase in design services at 50.2.

Market Data | Jun 19, 2019
Number of U.S. architects continues to rise
New data from NCARB reveals that the number of architects continues to increase.
Market Data | Jun 12, 2019
Construction input prices see slight increase in May
Among the 11 subcategories, six saw prices fall last month, with the largest decreases in natural gas.


