


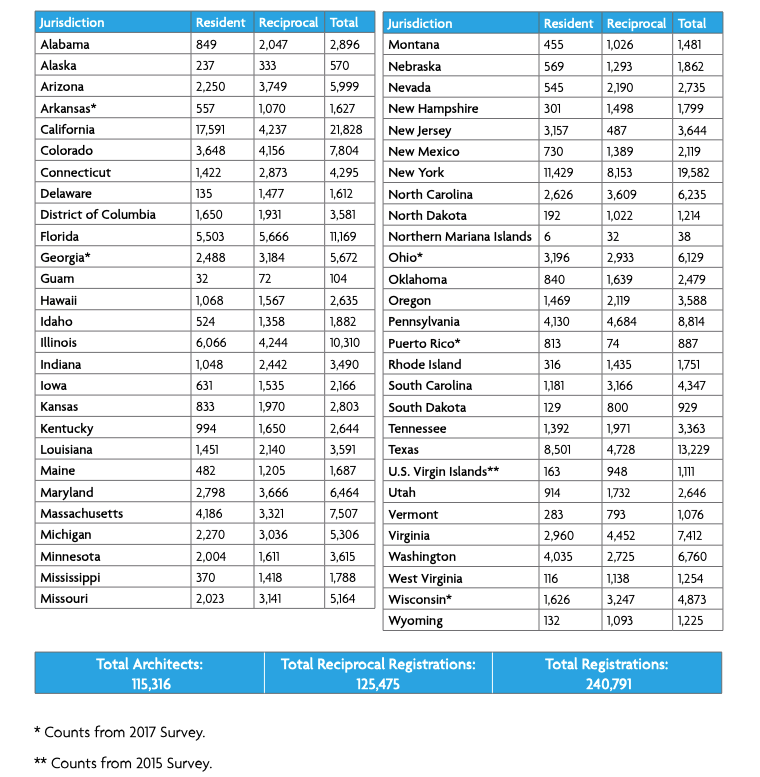
The number of architects licensed in the United States rose to 115,316 in 2018, according to the annual Survey of Architectural Registration Boards. This is a 2% increase from 2017 and represents a 13% increase compared to the number of U.S. architects seen a decade ago.
Conducted annually by the National Council of Architectural Registration Boards (NCARB), the survey provides exclusive insight into data from the architectural licensing boards of the 50 U.S. states, the District of Columbia, Guam, Puerto Rico, and the U.S. Virgin Islands, as well as the Northern Mariana Islands, which rejoined NCARB in 2018.
The increase in the number of architects is even more apparent when compared to the U.S. population: While the number of architects licensed in the U.S. has risen over 13% in the last decade, the total U.S. population has risen just 7%, according to data from the U.S. Census Bureau.
“This year’s data suggests that the profession is healthy and growing—and that NCARB’s services are just as important now as they were when our organization was founded 100 years ago,” said NCARB CEO Michael J. Armstrong.
Additional data from the upcoming 2019 NCARB by the Numbers regarding NCARB’s 100 years of history reflects the increased demand for the organization’s services. There are now over 115,000 individuals who hold an active NCARB Record, including nearly 41,000 candidates pursuing architectural licensure—a 1% increase in both Record holders and candidates compared to 2017.
The 2018 Survey of Architectural Registration Boards also reveals that there continue to be more reciprocal (outof-state) licenses than resident licenses issued in the U.S. There were 125,475 reciprocal licenses reported in 2018, which is largely unchanged from the amount seen in 2017. The steady number of reciprocal licenses indicates the effectiveness of the mobility pathway established by NCARB and the architectural licensing boards.
The survey reflects registration data from January to December 2018. Additional data on the path to licensure will be available in July’s 2019 edition of NCARB by the Numbers. To learn more about NCARB’s data and the Survey of Architectural Registration Boards, visit www.ncarb.org.
Related Stories

Hotel Facilities | Jul 27, 2023
U.S. hotel construction pipeline remains steady with 5,572 projects in the works
The hotel construction pipeline grew incrementally in Q2 2023 as developers and franchise companies push through short-term challenges while envisioning long-term prospects, according to Lodging Econometrics.

Hotel Facilities | Jul 26, 2023
Hospitality building construction costs for 2023
Data from Gordian breaks down the average cost per square foot for 15-story hotels, restaurants, fast food restaurants, and movie theaters across 10 U.S. cities: Boston, Chicago, Las Vegas, Los Angeles, Miami, New Orleans, New York, Phoenix, Seattle, and Washington, D.C.

Market Data | Jul 24, 2023
Leading economists call for 2% increase in building construction spending in 2024
Following a 19.7% surge in spending for commercial, institutional, and industrial buildings in 2023, leading construction industry economists expect spending growth to come back to earth in 2024, according to the July 2023 AIA Consensus Construction Forecast Panel.

Contractors | Jul 13, 2023
Construction input prices remain unchanged in June, inflation slowing
Construction input prices remained unchanged in June compared to the previous month, according to an Associated Builders and Contractors analysis of U.S. Bureau of Labor Statistics Producer Price Index data released today. Nonresidential construction input prices were also unchanged for the month.

Contractors | Jul 11, 2023
The average U.S. contractor has 8.9 months worth of construction work in the pipeline, as of June 2023
Associated Builders and Contractors reported that its Construction Backlog Indicator remained unchanged at 8.9 months in June 2023, according to an ABC member survey conducted June 20 to July 5. The reading is unchanged from June 2022.

Market Data | Jul 5, 2023
Nonresidential construction spending decreased in May, its first drop in nearly a year
National nonresidential construction spending decreased 0.2% in May, according to an Associated Builders and Contractors analysis of data published today by the U.S. Census Bureau. On a seasonally adjusted annualized basis, nonresidential spending totaled $1.06 trillion.

Apartments | Jun 27, 2023
Average U.S. apartment rent reached all-time high in May, at $1,716
Multifamily rents continued to increase through the first half of 2023, despite challenges for the sector and continuing economic uncertainty. But job growth has remained robust and new households keep forming, creating apartment demand and ongoing rent growth. The average U.S. apartment rent reached an all-time high of $1,716 in May.

Industry Research | Jun 15, 2023
Exurbs and emerging suburbs having fastest population growth, says Cushman & Wakefield
Recently released county and metro-level population growth data by the U.S. Census Bureau shows that the fastest growing areas are found in exurbs and emerging suburbs.

Contractors | Jun 13, 2023
The average U.S. contractor has 8.9 months worth of construction work in the pipeline, as of May 2023
Associated Builders and Contractors reported that its Construction Backlog Indicator remained unchanged at 8.9 months in May, according to an ABC member survey conducted May 20 to June 7. The reading is 0.1 months lower than in May 2022. Backlog in the infrastructure category ticked up again and has now returned to May 2022 levels. On a regional basis, backlog increased in every region but the Northeast.

Industry Research | Jun 13, 2023
Two new surveys track how the construction industry, in the U.S. and globally, is navigating market disruption and volatility
The surveys, conducted by XYZ Reality and KPMG International, found greater willingness to embrace technology, workplace diversity, and ESG precepts.


