


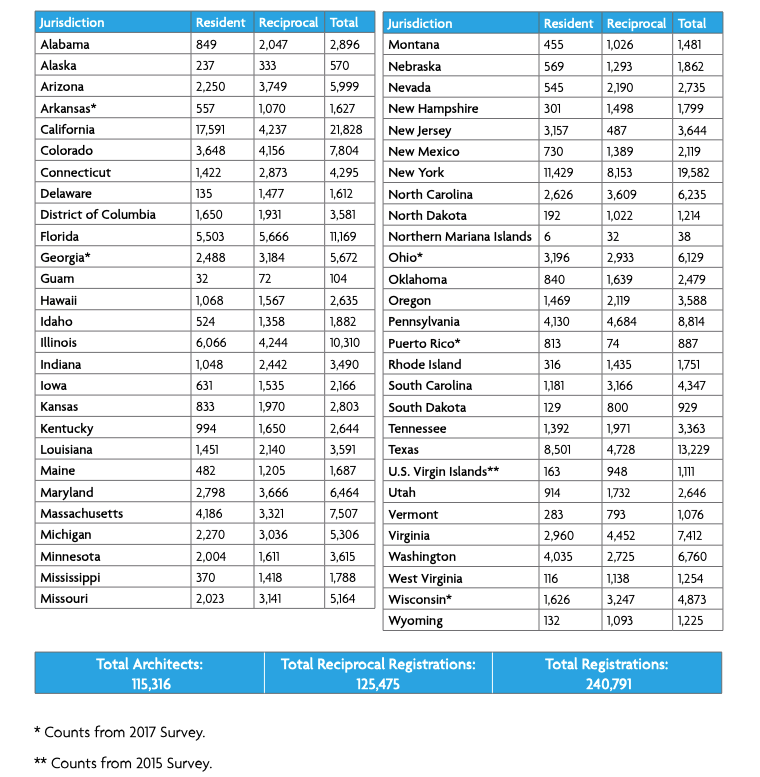
The number of architects licensed in the United States rose to 115,316 in 2018, according to the annual Survey of Architectural Registration Boards. This is a 2% increase from 2017 and represents a 13% increase compared to the number of U.S. architects seen a decade ago.
Conducted annually by the National Council of Architectural Registration Boards (NCARB), the survey provides exclusive insight into data from the architectural licensing boards of the 50 U.S. states, the District of Columbia, Guam, Puerto Rico, and the U.S. Virgin Islands, as well as the Northern Mariana Islands, which rejoined NCARB in 2018.
The increase in the number of architects is even more apparent when compared to the U.S. population: While the number of architects licensed in the U.S. has risen over 13% in the last decade, the total U.S. population has risen just 7%, according to data from the U.S. Census Bureau.
“This year’s data suggests that the profession is healthy and growing—and that NCARB’s services are just as important now as they were when our organization was founded 100 years ago,” said NCARB CEO Michael J. Armstrong.
Additional data from the upcoming 2019 NCARB by the Numbers regarding NCARB’s 100 years of history reflects the increased demand for the organization’s services. There are now over 115,000 individuals who hold an active NCARB Record, including nearly 41,000 candidates pursuing architectural licensure—a 1% increase in both Record holders and candidates compared to 2017.
The 2018 Survey of Architectural Registration Boards also reveals that there continue to be more reciprocal (outof-state) licenses than resident licenses issued in the U.S. There were 125,475 reciprocal licenses reported in 2018, which is largely unchanged from the amount seen in 2017. The steady number of reciprocal licenses indicates the effectiveness of the mobility pathway established by NCARB and the architectural licensing boards.
The survey reflects registration data from January to December 2018. Additional data on the path to licensure will be available in July’s 2019 edition of NCARB by the Numbers. To learn more about NCARB’s data and the Survey of Architectural Registration Boards, visit www.ncarb.org.
Related Stories

Hotel Facilities | Jan 22, 2024
U.S. hotel construction is booming, with a record-high 5,964 projects in the pipeline
The hotel construction pipeline hit record project counts at Q4, with the addition of 260 projects and 21,287 rooms over last quarter, according to Lodging Econometrics.

Multifamily Housing | Jan 15, 2024
Multifamily rent growth rate unchanged at 0.3%
The National Multifamily Report by Yardi Matrix highlights the highs and lows of the multifamily market in 2023. Despite strong demand, rent growth remained unchanged at 0.3 percent.

Self-Storage Facilities | Jan 5, 2024
The state of self-storage in early 2024
As the housing market cools down, storage facilities suffer from lower occupancy and falling rates, according to the December 2023 Yardi Matrix National Self Storage Report.

Designers | Dec 25, 2023
Redefining the workplace is a central theme in Gensler’s latest Design Report
The firm identifies eight mega trends that mostly stress human connections.

Contractors | Dec 12, 2023
The average U.S. contractor has 8.5 months worth of construction work in the pipeline, as of November 2023
Associated Builders and Contractors reported today that its Construction Backlog Indicator inched up to 8.5 months in November from 8.4 months in October, according to an ABC member survey conducted Nov. 20 to Dec. 4. The reading is down 0.7 months from November 2022.

Market Data | Nov 27, 2023
Number of employees returning to the office varies significantly by city
While the return-to-the-office trend is felt across the country, the percentage of employees moving back to their offices varies significantly according to geography, according to Eptura’s Q3 Workplace Index.

Market Data | Nov 14, 2023
The average U.S. contractor has 8.4 months worth of construction work in the pipeline, as of September 2023
Associated Builders and Contractors reported that its Construction Backlog Indicator declined to 8.4 months in October from 9.0 months in September, according to an ABC member survey conducted from Oct. 19 to Nov. 2. The reading is down 0.4 months from October 2022. Backlog now stands at its lowest level since the first quarter of 2022.

Multifamily Housing | Nov 9, 2023
Multifamily project completions forecast to slow starting 2026
Yardi Matrix has released its Q4 2023 Multifamily Supply Forecast, emphasizing a short-term spike and plateau of new construction.

Contractors | Nov 1, 2023
Nonresidential construction spending increases for the 16th straight month, in September 2023
National nonresidential construction spending increased 0.3% in September, according to an Associated Builders and Contractors analysis of data published today by the U.S. Census Bureau. On a seasonally adjusted annualized basis, nonresidential spending totaled $1.1 trillion.

Market Data | Oct 23, 2023
New data finds that the majority of renters are cost-burdened
The most recent data derived from the 2022 Census American Community Survey reveals that the proportion of American renters facing housing cost burdens has reached its highest point since 2012, undoing the progress made in the ten years leading up to the pandemic.


