


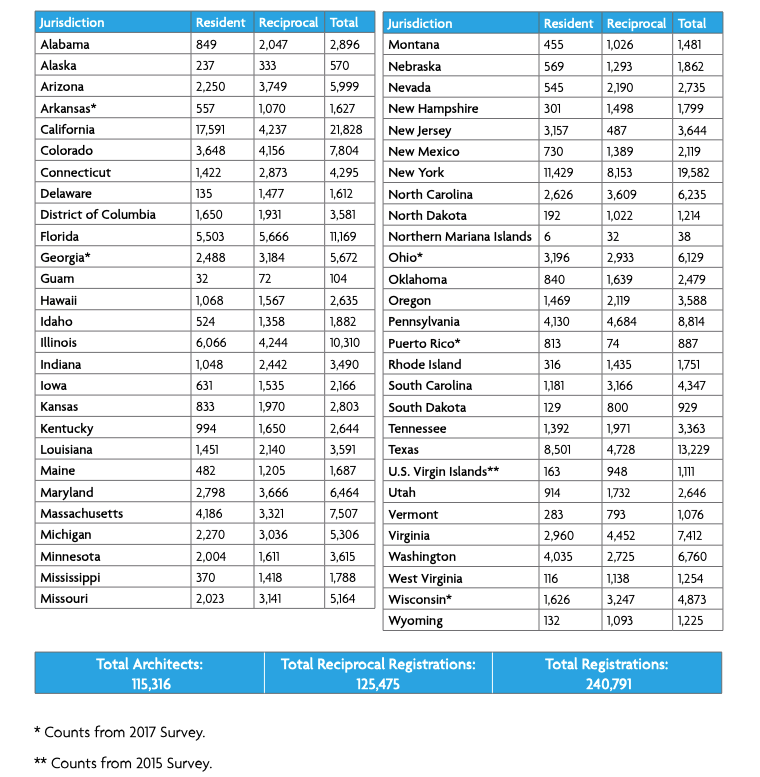
The number of architects licensed in the United States rose to 115,316 in 2018, according to the annual Survey of Architectural Registration Boards. This is a 2% increase from 2017 and represents a 13% increase compared to the number of U.S. architects seen a decade ago.
Conducted annually by the National Council of Architectural Registration Boards (NCARB), the survey provides exclusive insight into data from the architectural licensing boards of the 50 U.S. states, the District of Columbia, Guam, Puerto Rico, and the U.S. Virgin Islands, as well as the Northern Mariana Islands, which rejoined NCARB in 2018.
The increase in the number of architects is even more apparent when compared to the U.S. population: While the number of architects licensed in the U.S. has risen over 13% in the last decade, the total U.S. population has risen just 7%, according to data from the U.S. Census Bureau.
“This year’s data suggests that the profession is healthy and growing—and that NCARB’s services are just as important now as they were when our organization was founded 100 years ago,” said NCARB CEO Michael J. Armstrong.
Additional data from the upcoming 2019 NCARB by the Numbers regarding NCARB’s 100 years of history reflects the increased demand for the organization’s services. There are now over 115,000 individuals who hold an active NCARB Record, including nearly 41,000 candidates pursuing architectural licensure—a 1% increase in both Record holders and candidates compared to 2017.
The 2018 Survey of Architectural Registration Boards also reveals that there continue to be more reciprocal (outof-state) licenses than resident licenses issued in the U.S. There were 125,475 reciprocal licenses reported in 2018, which is largely unchanged from the amount seen in 2017. The steady number of reciprocal licenses indicates the effectiveness of the mobility pathway established by NCARB and the architectural licensing boards.
The survey reflects registration data from January to December 2018. Additional data on the path to licensure will be available in July’s 2019 edition of NCARB by the Numbers. To learn more about NCARB’s data and the Survey of Architectural Registration Boards, visit www.ncarb.org.
Related Stories

Market Data | Mar 14, 2024
Download BD+C's March 2024 Market Intelligence Report
U.S. construction spending on buildings-related work rose 1.4% in January, but project teams continue to face headwinds related to inflation, interest rates, and supply chain issues, according to Building Design+Construction's March 2024 Market Intelligence Report (free PDF download).

Contractors | Mar 12, 2024
The average U.S. contractor has 8.1 months worth of construction work in the pipeline, as of February 2024
Associated Builders and Contractors reported that its Construction Backlog Indicator declined to 8.1 months in February, according to an ABC member survey conducted Feb. 20 to March 5. The reading is down 1.1 months from February 2023.

Market Data | Mar 6, 2024
Nonresidential construction spending slips 0.4% in January
National nonresidential construction spending decreased 0.4% in January, according to an Associated Builders and Contractors analysis of data published today by the U.S. Census Bureau. On a seasonally adjusted annualized basis, nonresidential spending totaled $1.190 trillion.

Multifamily Housing | Mar 4, 2024
Single-family rentals continue to grow in BTR communities
Single-family rentals are continuing to grow in built-to-rent communities. Both rent and occupancy growth have been strong in recent months while remaining a financially viable option for renters.

MFPRO+ News | Mar 2, 2024
Job gains boost Yardi Matrix National Rent Forecast for 2024
Multifamily asking rents broke the five-month streak of sequential average declines in January, rising 0.07 percent, shows a new special report from Yardi Matrix.

K-12 Schools | Feb 29, 2024
Average age of U.S. school buildings is just under 50 years
The average age of a main instructional school building in the United States is 49 years, according to a survey by the National Center for Education Statistics (NCES). About 38% of schools were built before 1970. Roughly half of the schools surveyed have undergone a major building renovation or addition.

MFPRO+ Research | Feb 27, 2024
Most competitive rental markets of early 2024
The U.S. rental market in early 2024 is moderately competitive, with apartments taking an average of 41 days to find tenants, according to the latest RentCafe Market Competitivity Report.

Construction Costs | Feb 22, 2024
K-12 school construction costs for 2024
Data from Gordian breaks down the average cost per square foot for four different types of K-12 school buildings (elementary schools, junior high schools, high schools, and vocational schools) across 10 U.S. cities.

Student Housing | Feb 21, 2024
Student housing preleasing continues to grow at record pace
Student housing preleasing continues to be robust even as rent growth has decelerated, according to the latest Yardi Matrix National Student Housing Report.

Architects | Feb 21, 2024
Architecture Billings Index remains in 'declining billings' state in January 2024
Architecture firm billings remained soft entering into 2024, with an AIA/Deltek Architecture Billings Index (ABI) score of 46.2 in January. Any score below 50.0 indicates decreasing business conditions.


