

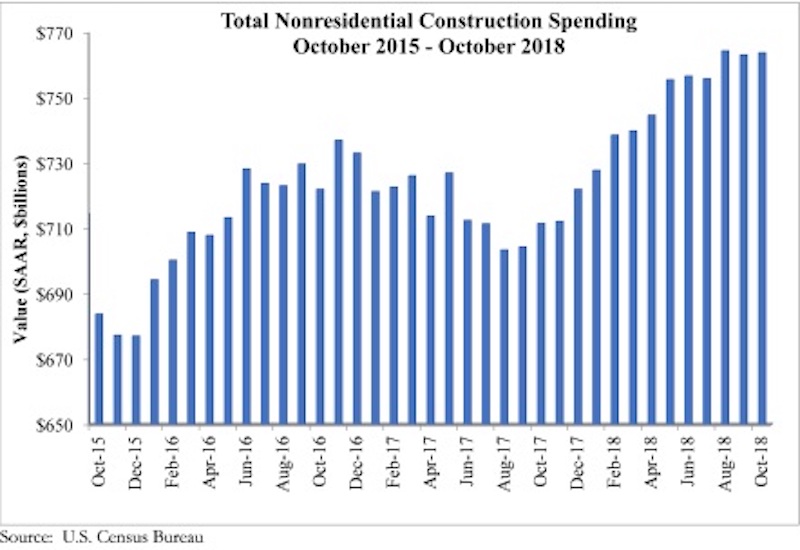
National nonresidential spending increased 0.1% in October, according to an Associated Builders and Contractors analysis of U.S. Census Bureau data released today. Total nonresidential spending for the month stood at $763.8 billion on a seasonally adjusted annualized rate, which represents a 7.3% increase over the same time last year.
Thirteen out of 16 subsectors are associated with year-over-year increases, with the exceptions being religious (-9.1%), communication (-4.7%), and health care (-1%). Water supply (+23%), lodging (+18.9%) and amusement and recreation (+16.2%) have generated the largest increases among nonresidential construction segments over the past 12 months.
“It is remarkable that the construction spending cycle remains firmly in place despite worker shortages, tariffs, rising materials prices, financial market volatility, more restrictive monetary policy, evidence of a slowing global economy and an abundance of political controversies,” said ABC Chief Economic Anirban Basu. “With backlog still elevated, nonresidential construction spending will enter 2019 with plentiful momentum.
“It is true that not all construction spending segments have participated in the industry’s recovery. However, the number of segments experiencing negative spending growth is small and the expectation is that a turnaround in spending is likely in at least one of these categories,” said Basu. “The religious category (-9.1% year-over-year) represents less than 1% of total nonresidential construction spending. Demographic forces and a strong economy should translate into growing demand for healthcare services, which will eventually trigger more construction in the health care category (-1%), including in the form of outpatient medical centers.
“While there will always be reasons to fret about the economic outlook, 2018 will go down as a fine year for the U.S. economy and for the nation’s nonresidential construction sector,” said Basu. “That said, while demand for construction services remained strong throughout the year, many contractors indicate that profit margins are under pressure. Given the ongoing dearth of available, skilled construction workers, that is likely to continue into 2019. However, materials price dynamics could be far different given a slowing global economy and expectations for a strong U.S. dollar next year.”
*Correction: This press release originally classified data centers as a component of the communications category. Data centers are instead a component of the office category.


Related Stories

Market Data | Jun 21, 2017
Design billings maintain solid footing, strong momentum reflected in project inquiries/design contracts
Balanced growth results in billings gains in all sectors.

Market Data | Jun 16, 2017
Residential construction was strong, but not enough, in 2016
The Joint Center for Housing Studies’ latest report expects minorities and millennials to account for the lion’s share of household formations through 2035.

Industry Research | Jun 15, 2017
Commercial Construction Index indicates high revenue and employment expectations for 2017
USG Corporation (USG) and U.S. Chamber of Commerce release survey results gauging confidence among industry leaders.

Market Data | Jun 2, 2017
Nonresidential construction spending falls in 13 of 16 segments in April
Nonresidential construction spending fell 1.7% in April 2017, totaling $696.3 billion on a seasonally adjusted, annualized basis, according to analysis of U.S. Census Bureau data released today by Associated Builders and Contractors.

Industry Research | May 25, 2017
Project labor agreement mandates inflate cost of construction 13%
Ohio schools built under government-mandated project labor agreements (PLAs) cost 13.12 percent more than schools that were bid and constructed through fair and open competition.

Market Data | May 24, 2017
Design billings increasing entering height of construction season
All regions report positive business conditions.

Market Data | May 24, 2017
The top franchise companies in the construction pipeline
3 franchise companies comprise 65% of all rooms in the Total Pipeline.

Industry Research | May 24, 2017
These buildings paid the highest property taxes in 2016
Office buildings dominate the list, but a residential community climbed as high as number two on the list.

Market Data | May 16, 2017
Construction firms add 5,000 jobs in April
Unemployment down to 4.4%; Specialty trade jobs dip slightly.

Multifamily Housing | May 10, 2017
May 2017 National Apartment Report
Median one-bedroom rent rose to $1,012 in April, the highest it has been since January.


