

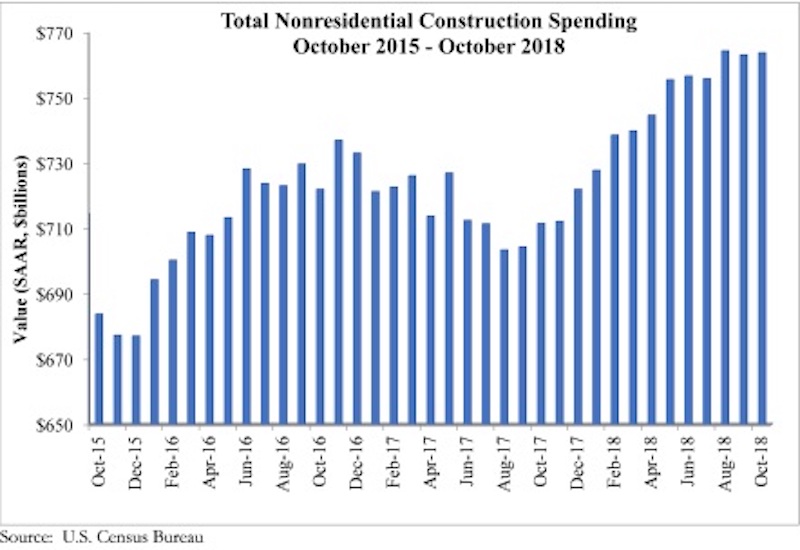
National nonresidential spending increased 0.1% in October, according to an Associated Builders and Contractors analysis of U.S. Census Bureau data released today. Total nonresidential spending for the month stood at $763.8 billion on a seasonally adjusted annualized rate, which represents a 7.3% increase over the same time last year.
Thirteen out of 16 subsectors are associated with year-over-year increases, with the exceptions being religious (-9.1%), communication (-4.7%), and health care (-1%). Water supply (+23%), lodging (+18.9%) and amusement and recreation (+16.2%) have generated the largest increases among nonresidential construction segments over the past 12 months.
“It is remarkable that the construction spending cycle remains firmly in place despite worker shortages, tariffs, rising materials prices, financial market volatility, more restrictive monetary policy, evidence of a slowing global economy and an abundance of political controversies,” said ABC Chief Economic Anirban Basu. “With backlog still elevated, nonresidential construction spending will enter 2019 with plentiful momentum.
“It is true that not all construction spending segments have participated in the industry’s recovery. However, the number of segments experiencing negative spending growth is small and the expectation is that a turnaround in spending is likely in at least one of these categories,” said Basu. “The religious category (-9.1% year-over-year) represents less than 1% of total nonresidential construction spending. Demographic forces and a strong economy should translate into growing demand for healthcare services, which will eventually trigger more construction in the health care category (-1%), including in the form of outpatient medical centers.
“While there will always be reasons to fret about the economic outlook, 2018 will go down as a fine year for the U.S. economy and for the nation’s nonresidential construction sector,” said Basu. “That said, while demand for construction services remained strong throughout the year, many contractors indicate that profit margins are under pressure. Given the ongoing dearth of available, skilled construction workers, that is likely to continue into 2019. However, materials price dynamics could be far different given a slowing global economy and expectations for a strong U.S. dollar next year.”
*Correction: This press release originally classified data centers as a component of the communications category. Data centers are instead a component of the office category.


Related Stories
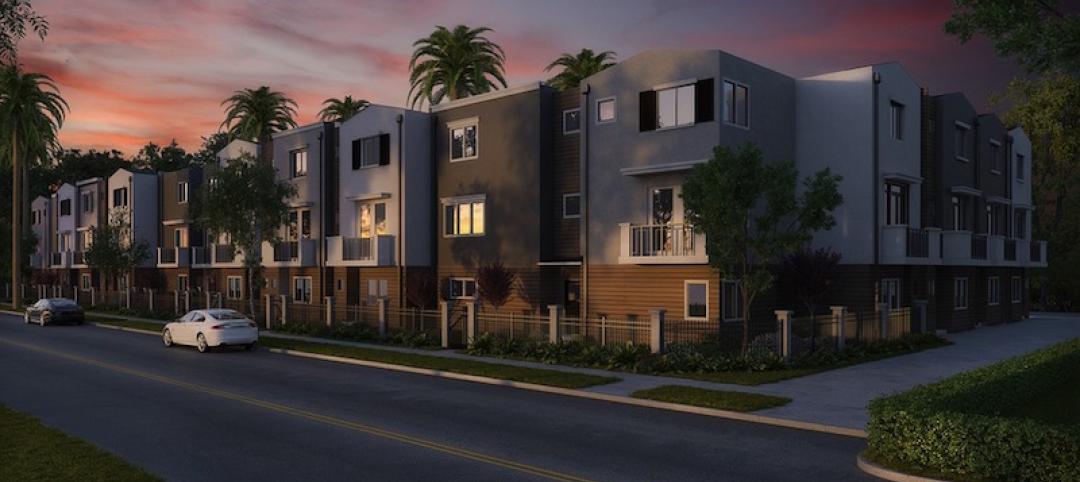
Multifamily Housing | Feb 15, 2018
United States ranks fourth for renter growth
Renters are on the rise in 21 of the 30 countries examined in RentCafé’s recent study.

Market Data | Feb 1, 2018
Nonresidential construction spending expanded 0.8% in December, brighter days ahead
“The tax cut will further bolster liquidity and confidence, which will ultimately translate into more construction starts and spending,” said ABC Chief Economist Anirban Basu.
Green | Jan 31, 2018
U.S. Green Building Council releases annual top 10 states for LEED green building per capita
Massachusetts tops the list for the second year; New York, Hawaii and Illinois showcase leadership in geographically diverse locations.

Industry Research | Jan 30, 2018
AIA’s Kermit Baker: Five signs of an impending upturn in construction spending
Tax reform implications and rebuilding from natural disasters are among the reasons AIA’s Chief Economist is optimistic for 2018 and 2019.

Market Data | Jan 30, 2018
AIA Consensus Forecast: 4.0% growth for nonresidential construction spending in 2018
The commercial office and retail sectors will lead the way in 2018, with a strong bounce back for education and healthcare.

Market Data | Jan 29, 2018
Year-end data show economy expanded in 2017; Fixed investment surged in fourth quarter
The economy expanded at an annual rate of 2.6% during the fourth quarter of 2017.

Market Data | Jan 25, 2018
Renters are the majority in 42 U.S. cities
Over the past 10 years, the number of renters has increased by 23 million.

Market Data | Jan 24, 2018
HomeUnion names the most and least affordable rental housing markets
Chicago tops the list as the most affordable U.S. metro, while Oakland, Calif., is the most expensive rental market.

Market Data | Jan 12, 2018
Construction input prices inch down in December, Up YOY despite low inflation
Energy prices have been more volatile lately.

Market Data | Jan 4, 2018
Nonresidential construction spending ticks higher in November, down year-over-year
Despite the month-over-month expansion, nonresidential spending fell 1.3 percent from November 2016.


