

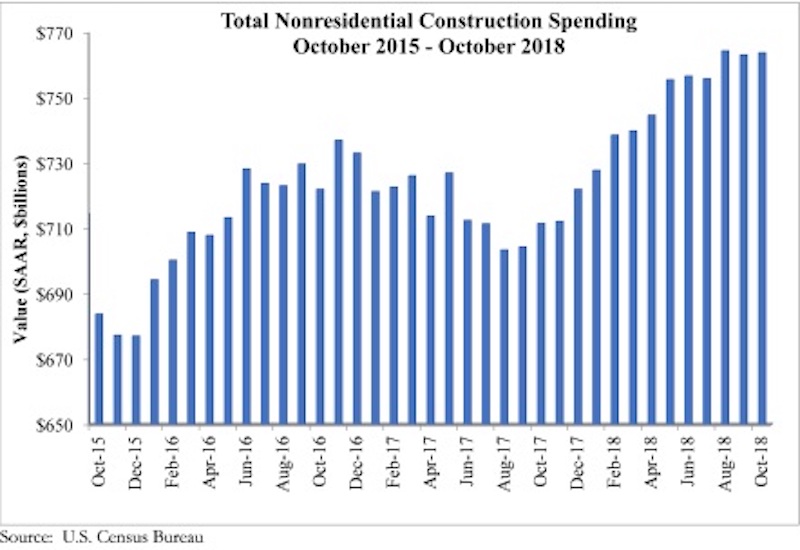
National nonresidential spending increased 0.1% in October, according to an Associated Builders and Contractors analysis of U.S. Census Bureau data released today. Total nonresidential spending for the month stood at $763.8 billion on a seasonally adjusted annualized rate, which represents a 7.3% increase over the same time last year.
Thirteen out of 16 subsectors are associated with year-over-year increases, with the exceptions being religious (-9.1%), communication (-4.7%), and health care (-1%). Water supply (+23%), lodging (+18.9%) and amusement and recreation (+16.2%) have generated the largest increases among nonresidential construction segments over the past 12 months.
“It is remarkable that the construction spending cycle remains firmly in place despite worker shortages, tariffs, rising materials prices, financial market volatility, more restrictive monetary policy, evidence of a slowing global economy and an abundance of political controversies,” said ABC Chief Economic Anirban Basu. “With backlog still elevated, nonresidential construction spending will enter 2019 with plentiful momentum.
“It is true that not all construction spending segments have participated in the industry’s recovery. However, the number of segments experiencing negative spending growth is small and the expectation is that a turnaround in spending is likely in at least one of these categories,” said Basu. “The religious category (-9.1% year-over-year) represents less than 1% of total nonresidential construction spending. Demographic forces and a strong economy should translate into growing demand for healthcare services, which will eventually trigger more construction in the health care category (-1%), including in the form of outpatient medical centers.
“While there will always be reasons to fret about the economic outlook, 2018 will go down as a fine year for the U.S. economy and for the nation’s nonresidential construction sector,” said Basu. “That said, while demand for construction services remained strong throughout the year, many contractors indicate that profit margins are under pressure. Given the ongoing dearth of available, skilled construction workers, that is likely to continue into 2019. However, materials price dynamics could be far different given a slowing global economy and expectations for a strong U.S. dollar next year.”
*Correction: This press release originally classified data centers as a component of the communications category. Data centers are instead a component of the office category.


Related Stories

Market Data | Jan 31, 2022
Canada's hotel construction pipeline ends 2021 with 262 projects and 35,325 rooms
At the close of 2021, projects under construction stand at 62 projects/8,100 rooms.

Market Data | Jan 27, 2022
Record high counts for franchise companies in the early planning stage at the end of Q4'21
Through year-end 2021, Marriott, Hilton, and IHG branded hotels represented 585 new hotel openings with 73,415 rooms.

Market Data | Jan 27, 2022
Dallas leads as the top market by project count in the U.S. hotel construction pipeline at year-end 2021
The market with the greatest number of projects already in the ground, at the end of the fourth quarter, is New York with 90 projects/14,513 rooms.

Market Data | Jan 26, 2022
2022 construction forecast: Healthcare, retail, industrial sectors to lead ‘healthy rebound’ for nonresidential construction
A panel of construction industry economists forecasts 5.4 percent growth for the nonresidential building sector in 2022, and a 6.1 percent bump in 2023.

Market Data | Jan 24, 2022
U.S. hotel construction pipeline stands at 4,814 projects/581,953 rooms at year-end 2021
Projects scheduled to start construction in the next 12 months stand at 1,821 projects/210,890 rooms at the end of the fourth quarter.

Market Data | Jan 19, 2022
Architecture firms end 2021 on a strong note
December’s Architectural Billings Index (ABI) score of 52.0 was an increase from 51.0 in November.

Market Data | Jan 13, 2022
Materials prices soar 20% in 2021 despite moderating in December
Most contractors in association survey list costs as top concern in 2022.

Market Data | Jan 12, 2022
Construction firms forsee growing demand for most types of projects
Seventy-four percent of firms plan to hire in 2022 despite supply-chain and labor challenges.

Market Data | Jan 7, 2022
Construction adds 22,000 jobs in December
Jobless rate falls to 5% as ongoing nonresidential recovery offsets rare dip in residential total.

Market Data | Jan 6, 2022
Inflation tempers optimism about construction in North America
Rider Levett Bucknall’s latest report cites labor shortages and supply chain snags among causes for cost increases.


