


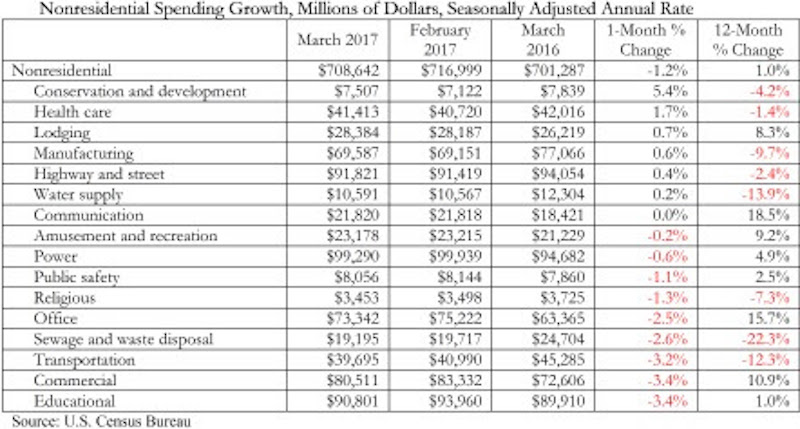
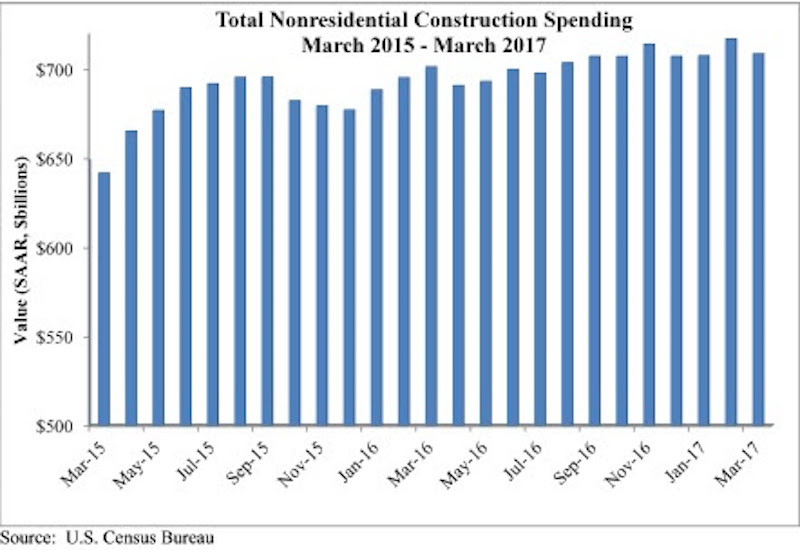
Nonresidential construction spending fell 1.2 percent in March, according to analysis of U.S. Census Bureau data recently released by Associated Builders and Contractors (ABC). Spending in the segment totaled $708.6 billion on a seasonally adjusted, annualized basis, however the decline is less dramatic than it may be perceived to be given that February’s initial estimate of $701.6 billion was upwardly revised to $717 billion, making it the highest level or spending recorded in the data series.
In March, private nonresidential construction spending fell 1.3 percent for the month, but remains up 6.4 percent on a year-ago basis. Public nonresidential spending decreased by 0.9 percent and is down 6.5 percent year over year. Were it not for the manufacturing subsector, where spending has contracted 9.7 percent from the same time last year, overall spending would have increased from February and set a new record high for construction spending.
“There are at least two tales to tell, and neither one of them is particularly uplifting,” said ABC Chief Economist Anirban Basu. “One narrative relates to public spending, which remains soft. Even categories in which one might have expected spending growth have not experienced an increase over past year. For instance, one might have anticipated stepped-up spending in the water supply category given the events in Flint, Mich. But spending in that category is down by roughly 14 percent over the past year. Similarly, one might have predicted spending increases in the highway and street category since the Fixing America’s Surface Transportation Act was passed in December 2015. However, spending in that category is down 2.4 percent on a year-over-year basis.
“Private construction spending has lost momentum as well, perhaps because developers and their financiers are becoming increasingly unnerved by the possibility of mini-bubbles in certain commercial real estate segments,” said Basu. “Many investors may also have adopted a wait-and-see attitude regarding policies coming out of Washington, D.C., including those related to proposed tax reform and infrastructure spending initiatives. Perhaps as a result, office and commercial-related construction spending declined in March. Still, other data suggest lingering momentum in various privately-financed segments, and data from the most recent GDP report indicate that investors continue to invest aggressively in structures. It is for this reason that today’s construction spending release is at least somewhat surprising with respect to private investment in structures. An upward revision to today’s data may be forthcoming.
“Looking ahead, all eyes are on Washington, D.C,” said Basu. “A pro-business agenda remains in the works, but little of it has been implemented thus far. Financial markets continue to express confidence regarding the ultimate execution of significant portions of this agenda, but if it remains bogged down politically, market confidence will wane and private construction spending will continue to be erratic.”
Related Stories

Market Data | Nov 27, 2023
Number of employees returning to the office varies significantly by city
While the return-to-the-office trend is felt across the country, the percentage of employees moving back to their offices varies significantly according to geography, according to Eptura’s Q3 Workplace Index.

Market Data | Nov 14, 2023
The average U.S. contractor has 8.4 months worth of construction work in the pipeline, as of September 2023
Associated Builders and Contractors reported that its Construction Backlog Indicator declined to 8.4 months in October from 9.0 months in September, according to an ABC member survey conducted from Oct. 19 to Nov. 2. The reading is down 0.4 months from October 2022. Backlog now stands at its lowest level since the first quarter of 2022.

Multifamily Housing | Nov 9, 2023
Multifamily project completions forecast to slow starting 2026
Yardi Matrix has released its Q4 2023 Multifamily Supply Forecast, emphasizing a short-term spike and plateau of new construction.

Contractors | Nov 1, 2023
Nonresidential construction spending increases for the 16th straight month, in September 2023
National nonresidential construction spending increased 0.3% in September, according to an Associated Builders and Contractors analysis of data published today by the U.S. Census Bureau. On a seasonally adjusted annualized basis, nonresidential spending totaled $1.1 trillion.

Market Data | Oct 23, 2023
New data finds that the majority of renters are cost-burdened
The most recent data derived from the 2022 Census American Community Survey reveals that the proportion of American renters facing housing cost burdens has reached its highest point since 2012, undoing the progress made in the ten years leading up to the pandemic.

Contractors | Oct 19, 2023
Crane Index indicates slowing private-sector construction
Private-sector construction in major North American cities is slowing, according to the latest RLB Crane Index. The number of tower cranes in use declined 10% since the first quarter of 2023. The index, compiled by consulting firm Rider Levett Bucknall (RLB), found that only two of 14 cities—Boston and Toronto—saw increased crane counts.

Market Data | Oct 2, 2023
Nonresidential construction spending rises 0.4% in August 2023, led by manufacturing and public works sectors
National nonresidential construction spending increased 0.4% in August, according to an Associated Builders and Contractors analysis of data published today by the U.S. Census Bureau. On a seasonally adjusted annualized basis, nonresidential spending totaled $1.09 trillion.

Giants 400 | Sep 28, 2023
Top 100 University Building Construction Firms for 2023
Turner Construction, Whiting-Turner Contracting Co., STO Building Group, Suffolk Construction, and Skanska USA top BD+C's ranking of the nation's largest university sector contractors and construction management firms for 2023, as reported in Building Design+Construction's 2023 Giants 400 Report. Note: This ranking includes revenue for all university/college-related buildings except student residence halls, sports/recreation facilities, laboratories, S+T-related buildings, parking facilities, and performing arts centers (revenue for those buildings are reported in their respective Giants 400 ranking).

Construction Costs | Sep 28, 2023
U.S. construction market moves toward building material price stabilization
The newly released Quarterly Construction Cost Insights Report for Q3 2023 from Gordian reveals material costs remain high compared to prior years, but there is a move towards price stabilization for building and construction materials after years of significant fluctuations. In this report, top industry experts from Gordian, as well as from Gilbane, McCarthy Building Companies, and DPR Construction weigh in on the overall trends seen for construction material costs, and offer innovative solutions to navigate this terrain.

Data Centers | Sep 21, 2023
North American data center construction rises 25% to record high in first half of 2023, driven by growth of artificial intelligence
CBRE’s latest North American Data Center Trends Report found there is 2,287.6 megawatts (MW) of data center supply currently under construction in primary markets, reaching a new all-time high with more than 70% already preleased.


