

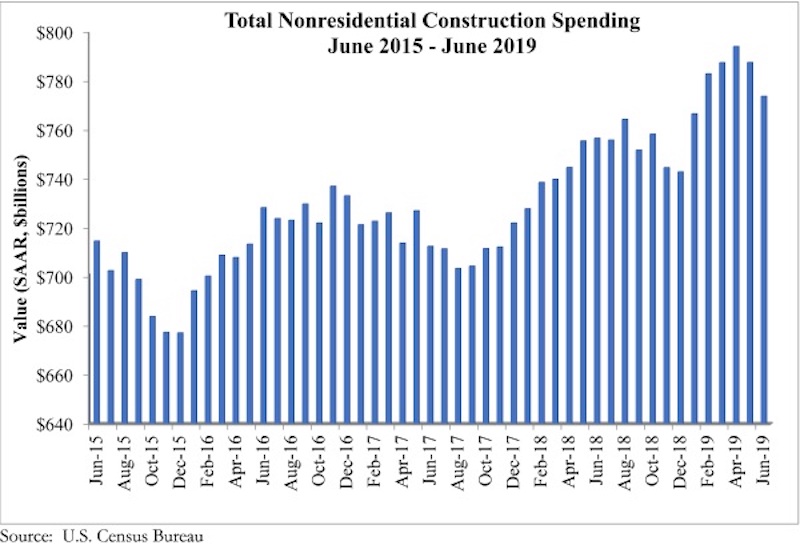
National nonresidential construction spending declined 1.8% in June, totaling $773.8 billion on a seasonally adjusted annualized basis—a 2.3% increase compared to the same time a year ago, according to an Associated Builders and Contractors analysis of U.S. Census Bureau data published today. Public nonresidential spending fell 3.7% in June, but is up 6.4% year over year, while private nonresidential spending fell 0.3% on a monthly basis and is up 0.4% from June 2018.
Among the 16 nonresidential construction spending categories tracked by the Census Bureau, seven experienced increases in monthly spending, although only the conservation and development (+3.8%) and commercial (+1.3%) categories increased by more than 1%. While spending in several categories fell for the month, significant decreases in the publicly driven educational (-6.5%) and highway and street (-6.3%) categories accounted for nearly all of the monthly decline.
“Like the balance of the U.S. economy, nonresidential construction spending appears to be softening, albeit gradually,” said ABC Chief Economist Anirban Basu. “Private nonresidential construction spending has been trending lower for several months, and segments like office and lodging are no longer the drivers of construction spending growth that they had been, likely due to growing concerns about market saturation.
“The dip in public construction may have been merely temporary, which is likely the case given the ongoing strength of state and local government finances.” said Basu. “And with the economy still adding substantial numbers of jobs, wages growing at or near a decade-high pace, consumers continuing to spend and property values remaining stable, local and state governments should continue to experience solid income, retail and real estate tax collections. All things being equal, that should help fuel infrastructure outlays, especially given still very low borrowing costs.
“While many observers continue to focus on issues such as trade disputes, high levels of corporate debt and asset prices that are susceptible to sharp declines, the U.S. construction industry’s most significant source of uncertainty may be the pending insolvency of the Highway Trust Fund,” said Basu. “That insolvency is now a mere two years away, and if policymakers fail to act expeditiously, state and local policymakers may choose to postpone certain projects given the rising uncertainty of federal funding. The highway/street and transportation categories are especially vulnerable to such dynamics.”


Related Stories

Market Data | Feb 20, 2019
Strong start to 2019 for architecture billings
“The government shutdown affected architecture firms, but doesn’t appear to have created a slowdown in the profession,” said AIA Chief Economist Kermit Baker, Hon. AIA, PhD, in the latest ABI report.

Market Data | Feb 19, 2019
ABC Construction Backlog Indicator steady in Q4 2018
CBI reached a record high of 9.9 months in the second quarter of 2018 and averaged about 9.1 months throughout all four quarters of last year.

Market Data | Feb 14, 2019
U.S. Green Building Council announces top 10 countries and regions for LEED green building
The list ranks countries and regions in terms of cumulative LEED-certified gross square meters as of December 31, 2018.

Market Data | Feb 13, 2019
Increasingly tech-enabled construction industry powers forward despite volatility
Construction industry momentum to carry through first half of 2019.

Market Data | Feb 4, 2019
U.S. Green Building Council announces annual Top 10 States for LEED Green Building in 2018
Illinois takes the top spot as USGBC defines the next generation of green building with LEED v4.1.

Market Data | Feb 4, 2019
Nonresidential construction spending dips in November
Total nonresidential spending stood at $751.5 billion on a seasonally adjusted annualized rate.

Market Data | Feb 1, 2019
The year-end U.S. hotel construction pipeline continues steady growth trend
Project counts in the early planning stage continue to rise reaching an all-time high of 1,723 projects/199,326 rooms.

Market Data | Feb 1, 2019
Construction spending is projected to increase by more than 11% through 2022
FMI’s annual outlook also expects the industry’s frantic M&A activity to be leavened by caution going forward.

Market Data | Jan 23, 2019
Architecture billings slow, but close 2018 with growing demand
AIA’s Architecture Billings Index (ABI) score for December was 50.4 compared to 54.7 in November.

Market Data | Jan 16, 2019
AIA 2019 Consensus Forecast: Nonresidential construction spending to rise 4.4%
The education, public safety, and office sectors will lead the growth areas this year, but AIA's Kermit Baker offers a cautious outlook for 2020.


