


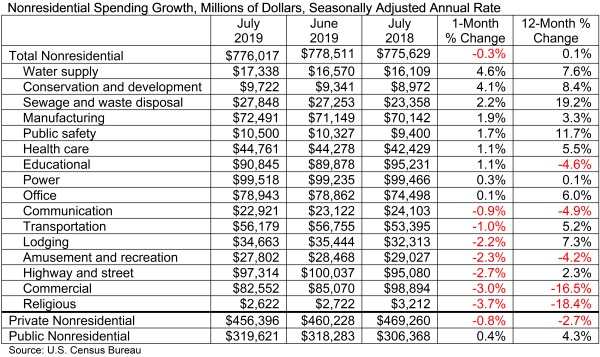
According to an Associated Builders and Contractors analysis of U.S. Census Bureau data published today, national nonresidential construction spending declined 0.3% in July totaling $776 billion on a seasonally adjusted annualized basis, and increased 0.1% compared to July 2018. The June 2019 estimates were revised upward from $773.8 billion to $778.5 billion.
In July, private nonresidential spending decreased 0.8% on a monthly basis and 2.7% on a yearly basis. Public nonresidential spending, however, increased 0.4% for the month and 4.3% for the year.
"While there is much discussion regarding the extent to which the U.S. economy has slowed and will slow going forward, these considerations have relatively little to do with today's nonresidential construction spending data," said ABC Chief Economist Anirban Basu. "Trends in nonresidential construction tend to lag the broader economy by a year to 18 months, which means that today's construction spending numbers reflect in large measure broader economic dynamics characterizing 2018. Last year was a good one for the economy, persuading many to move ahead with projects.
"Recent construction spending data, therefore, have been impacted by factors more closely related to the industry," said Basu. "For instance, the recent weakening in certain private construction segments, including office and lodging, are likely due to growing concerns regarding overbuilding and the somewhat higher cost of capital. Public spending growth, despite solid numbers in July, has been more erratic of late. This may have something to do with the looming insolvency of the Highway Trust Fund, which is expected in 2021 without congressional action. There is already evidence that some states have begun to postpone planning for new projects until there is more clarity regarding federal infrastructure spending, evident in the 2.7% spending decline observed in the highway and street category.
"Despite recent slow growth in construction spending, the U.S. construction industry has continued to expand employment levels during the past year," said Basu. "ABC’s Construction Backlog Indicator continues to show that the average contractor or subcontractor will remain busy over the near term. One of the reasons for relatively slow growth in nonresidential construction spending may simply be that the U.S. contracting community cannot deliver significantly more service in the context of worsening labor/skills shortages. In other words, nonresidential construction volume may already be near its peak potential supply. Given that, one wouldn't expect substantial growth in construction spending even in the context of significantly stronger economic growth."
Related Stories

Market Data | Jun 21, 2017
Design billings maintain solid footing, strong momentum reflected in project inquiries/design contracts
Balanced growth results in billings gains in all sectors.

Market Data | Jun 16, 2017
Residential construction was strong, but not enough, in 2016
The Joint Center for Housing Studies’ latest report expects minorities and millennials to account for the lion’s share of household formations through 2035.

Industry Research | Jun 15, 2017
Commercial Construction Index indicates high revenue and employment expectations for 2017
USG Corporation (USG) and U.S. Chamber of Commerce release survey results gauging confidence among industry leaders.

Market Data | Jun 2, 2017
Nonresidential construction spending falls in 13 of 16 segments in April
Nonresidential construction spending fell 1.7% in April 2017, totaling $696.3 billion on a seasonally adjusted, annualized basis, according to analysis of U.S. Census Bureau data released today by Associated Builders and Contractors.

Industry Research | May 25, 2017
Project labor agreement mandates inflate cost of construction 13%
Ohio schools built under government-mandated project labor agreements (PLAs) cost 13.12 percent more than schools that were bid and constructed through fair and open competition.

Market Data | May 24, 2017
Design billings increasing entering height of construction season
All regions report positive business conditions.

Market Data | May 24, 2017
The top franchise companies in the construction pipeline
3 franchise companies comprise 65% of all rooms in the Total Pipeline.

Industry Research | May 24, 2017
These buildings paid the highest property taxes in 2016
Office buildings dominate the list, but a residential community climbed as high as number two on the list.

Market Data | May 16, 2017
Construction firms add 5,000 jobs in April
Unemployment down to 4.4%; Specialty trade jobs dip slightly.

Multifamily Housing | May 10, 2017
May 2017 National Apartment Report
Median one-bedroom rent rose to $1,012 in April, the highest it has been since January.


