

Construction spending was a tale of two industries again in November, as soaring single-family construction masked ongoing downturns in private and public nonresidential construction, according to an analysis of new federal construction spending data by the Associated General Contractors of America. Association officials said the new figures underscore the need for new infrastructure investments and other measures to boost demand for nonresidential construction amid the pandemic.
“Private nonresidential construction declined for the fifth-straight month in November, while public nonresidential spending slipped for the fifth time in the past six months,” said Ken Simonson, the association’s chief economist. “Unfortunately, our latest survey finds contractors expect the volume of projects available to bid on in 2021 will be even more meager.”
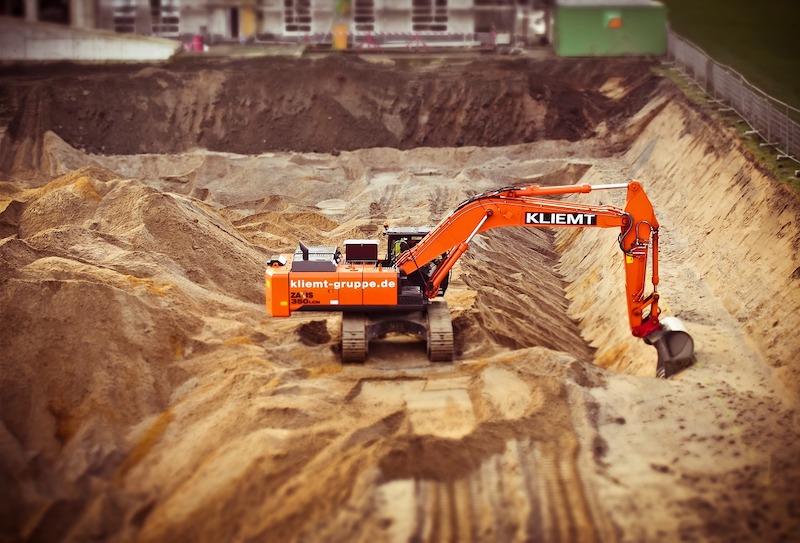
Construction spending in November totaled $1.46 trillion at a seasonally adjusted annual rate, an increase of 0.9% from the pace in October and 3.8% higher than in November 2019. But the gains were limited to residential construction, which soared 2.6% for the month and 16.2% year-over-year. Meanwhile, private and public nonresidential spending slumped 0.6% from October and 4.7% from a year earlier.
Private nonresidential construction spending decreased for the fifth month in a row, sliding 0.8% from October to November and 9.5% from November 2019. The largest private nonresidential segment, power construction, declined 0.9% for the month. Among the other large private nonresidential project types, commercial construction—comprising retail, warehouse and farm structures—dipped 0.3% for the month, manufacturing construction inched up 0.1%, office construction gained 0.3%, and healthcare construction fell 1.4%.
Public construction spending declined 0.2% for the month but increased 3.1% year-over-year. There were decreases from October to November for most nonresidential categories, although the two largest segments rose: highway and street construction gained 1.8% for the month, while educational construction increased 0.3%.
Private residential construction spending increased for the sixth consecutive month, rising 2.7% in November. Single-family homebuilding jumped 5.1% for the month, while residential improvements spending ticked up 0.2%. Multifamily construction spending was flat.
Association officials said demand for most types of nonresidential construction was likely to remain down for much of the year. They added that they would have more insights on the state of the industry when the association and Sage release their annual Construction Hiring & Business Outlook on Thursday, January 7. In the meantime, they urged the incoming Congress to act quickly to boost investments in infrastructure and pass liability reforms to protect firms that employ necessary safety protocols to protect theirs workers and the public from meritless coronavirus lawsuits.
“Without additional measures to boost demand for nonresidential construction, this year is likely to be a challenging one for the industry,” said Stephen E. Sandherr, the association’s chief executive officer. “The impacts of the pandemic are clearly accumulating for many construction employers.”
Related Stories

Market Data | Apr 4, 2016
ABC: Nonresidential spending slip in February no cause for alarm
Spending in the nonresidential sector totaled $690.3 billion on a seasonally adjusted, annualized basis in February. The figure is a step back but still significantly higher than one year ago.

Market Data | Mar 30, 2016
10 trends for commercial real estate: JLL report
The report looks at global threats and opportunities, and how CRE firms are managing their expectations for growth.

Market Data | Mar 23, 2016
AIA: Modest expansion for Architecture Billings Index
Business conditions softening most in Midwest in recent months.

Retail Centers | Mar 16, 2016
Food and technology will help tomorrow’s malls survive, says CallisonRTKL
CallisonRTKL foresees future retail centers as hubs with live/work/play components.

Market Data | Mar 6, 2016
Real estate execs measure success by how well they manage ‘talent,’ costs, and growth
A new CBRE survey finds more companies leaning toward “smarter” workspaces.

Market Data | Mar 1, 2016
ABC: Nonresidential spending regains momentum in January
Nonresidential construction spending expanded 2.5% on a monthly basis and 12.3% on a yearly basis, totaling $701.9 billion. Spending increased in January in 10 of 16 nonresidential construction sectors.

Market Data | Mar 1, 2016
Leopardo releases 2016 Construction Economics Report
This year’s report shows that spending in 2015 reached the highest level since the Great Recession. Total spending on U.S. construction grew 10.5% to $1.1 trillion, the largest year-over-year gain since 2007.

Market Data | Feb 26, 2016
JLL upbeat about construction through 2016
Its latest report cautions about ongoing cost increases related to finding skilled laborers.

Market Data | Feb 17, 2016
AIA reports slight contraction in Architecture Billings Index
Multifamily residential sector improving after sluggish 2015.

Market Data | Feb 11, 2016
AIA: Continued growth expected in nonresidential construction
The American Institute of Architects’ semi-annual Consensus Construction Forecast indicates a growth of 8% in construction spending in 2016, and 6.7% the following year.


