

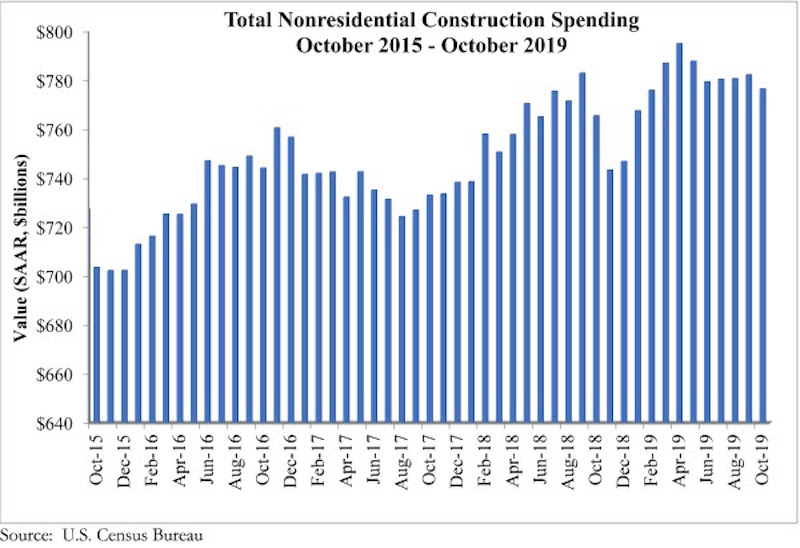
National nonresidential construction spending fell 0.7% in October but is up 1.4% compared to the same time last year, according to an Associated Builders and Contractors analysis of data published today by the U.S. Census Bureau. On a seasonally adjusted annualized basis, spending totaled $776.5 billion, 2.3% lower than the cyclical peak attained in April 2019.
Private nonresidential spending fell 1.2% on a monthly basis and is down 4.3% from October 2018. Public nonresidential construction spending also declined on a monthly basis, falling 0.1%. On an annual basis, however, public nonresidential spending is up 10.4%.
“At this point, economic indicators are providing mixed signals about the U.S. construction industry’s trajectory,” said ABC Chief Economist Anirban Basu. “Today’s release suggests that the industry’s spending cycle is winding toward a close and has been for about six months. Yet, according to the October employment data or ABC’s Construction Backlog Indicator, the story is very different. Those data tell the tale of an industry still wrestling with enormous levels of work and ongoing labor shortages.
“Moreover, though overall nonresidential construction spending is a bit lower than it was six months ago, there are still segments that are performing well,” said Basu. “A number of public construction segments experienced solid growth on monthly and annual bases, including public safety, conservation/development (e.g. flood control), educational and water supply. With state and local government budgets still generally healthy, spending on public works will conceivably remain elevated for the foreseeable future.
“The primary source of weakness has been private construction,” said Basu. “This is consistent with recent readings of ABC’s Construction Confidence Index and a number of other leading indicators. Among the segments softening the fastest are the manufacturing and commercial segments, which are both down on monthly and year-ago bases. Commercial construction is down more than 16% over the past year, which coincides with the fact that 2019 will set a record for store closings in the U.S. as e-commerce continues to gobble up market share. Lodging and office-related construction has also slowed of late, likely because developers have already exhausted many of the best investment opportunities.”


Related Stories

Market Data | Aug 2, 2017
Nonresidential Construction Spending falls in June, driven by public sector
June’s weak construction spending report can be largely attributed to the public sector.

Market Data | Jul 31, 2017
U.S. economic growth accelerates in second quarter; Nonresidential fixed investment maintains momentum
Nonresidential fixed investment, a category of GDP embodying nonresidential construction activity, expanded at a 5.2% seasonally adjusted annual rate.

Multifamily Housing | Jul 27, 2017
Apartment market index: Business conditions soften, but still solid
Despite some softness at the high end of the apartment market, demand for apartments will continue to be substantial for years to come, according to the National Multifamily Housing Council.

Market Data | Jul 25, 2017
What's your employer value proposition?
Hiring and retaining talent is one of the top challenges faced by most professional services firms.

Market Data | Jul 25, 2017
Moderating economic growth triggers construction forecast downgrade for 2017 and 2018
Prospects for the construction industry have weakened with developments over the first half of the year.

Industry Research | Jul 6, 2017
The four types of strategic real estate amenities
From swimming pools to pirate ships, amenities (even crazy ones) aren’t just perks, but assets to enhance performance.
Market Data | Jun 29, 2017
Silicon Valley, Long Island among the priciest places for office fitouts
Coming out on top as the most expensive market to build out an office is Silicon Valley, Calif., with an out-of-pocket cost of $199.22.

Market Data | Jun 26, 2017
Construction disputes were slightly less contentious last year
But poorly written and administered contracts are still problems, says latest Arcadis report.

Industry Research | Jun 26, 2017
Time to earn an architecture license continues to drop
This trend is driven by candidates completing the experience and examination programs concurrently and more quickly.

Industry Research | Jun 22, 2017
ABC's Construction Backlog Indicator rebounds in 2017
The first quarter showed gains in all categories.


