

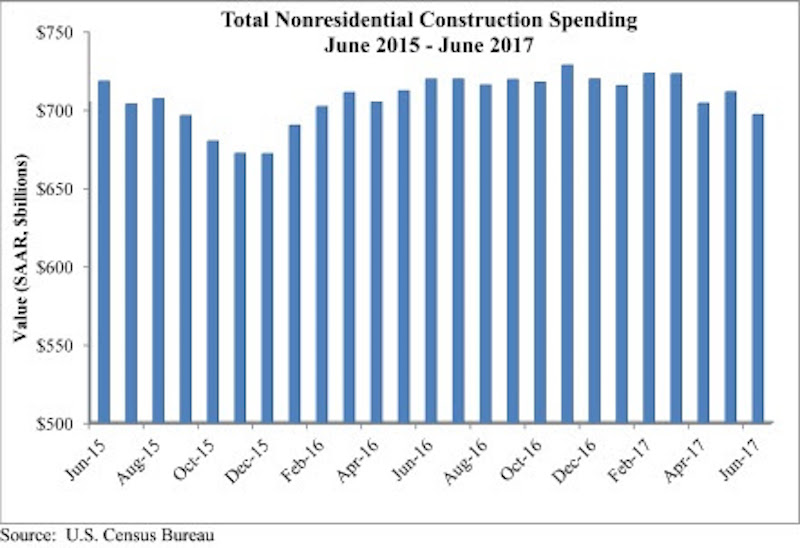
Nonresidential construction spending fell by 2% on a monthly basis in June 2017, totaling $697 billion on a seasonally adjusted, annualized basis according to an analysis of U.S. Census Bureau data released today by Associated Builders and Contractors. June represents the first month during which spending has dipped below the $700 billion per year threshold since January 2016.
June’s weak construction spending report can be largely attributed to the public sector. Public nonresidential construction spending fell 5.4% for the month and 9.5% for the year, and all twelve public subsectors decreased for the month. Private nonresidential spending remained largely unchanged, increasing by 0.1% for the month and 1.1% for the year. April and May nonresidential spending figures were revised downward by 1.1% and 0.4%, respectively.
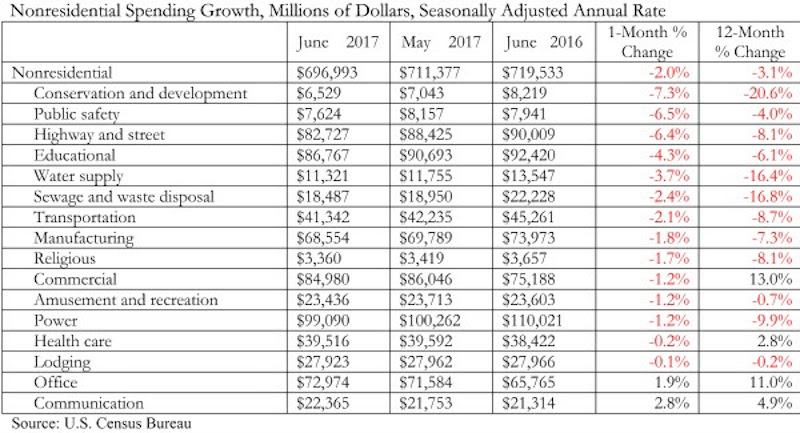
“Coming into the year, there were high hopes for infrastructure spending in America,” said ABC Chief Economist Anirban Basu. “The notion was that after many years of a lack of attention to public works, newfound energy coming from Washington, D.C., would spur confidence in federal funding among state and local transportation directors as well among others who purchase construction services. Instead, public construction spending is on the decline in America. Categories including public safety and flood control have experienced dwindling support for investment, translating into a nine percent decline in public construction spending over the past twelve months.
“On the other hand, several private segments continue to manifest strength in terms of demand for construction services,” said Basu. “At the head of the class are office construction, driven by a combination of job growth among certain office-space-using categories as well as lofty valuations, and communications, which is being driven largely by enormous demand for data center capacity.

“While there are certainly some parts of the nation experiencing significant levels of public construction, those areas have increasingly become the exception as opposed to the rule,” said Basu. “The more general and pervasive strength is in private segments. Based on recent readings of the architecture billings index and other key leading indicators, commercial contractors are likely to remain busy for the foreseeable future. The outlook for construction firms engaged in public work remains unclear.”
Related Stories

Market Data | Aug 4, 2017
U.S. grand total construction starts growth projection revised slightly downward
ConstructConnect’s quarterly report shows courthouses and sports stadiums to end 2017 with a flourish.

Market Data | Jul 31, 2017
U.S. economic growth accelerates in second quarter; Nonresidential fixed investment maintains momentum
Nonresidential fixed investment, a category of GDP embodying nonresidential construction activity, expanded at a 5.2% seasonally adjusted annual rate.

Multifamily Housing | Jul 27, 2017
Apartment market index: Business conditions soften, but still solid
Despite some softness at the high end of the apartment market, demand for apartments will continue to be substantial for years to come, according to the National Multifamily Housing Council.

Market Data | Jul 25, 2017
What's your employer value proposition?
Hiring and retaining talent is one of the top challenges faced by most professional services firms.

Market Data | Jul 25, 2017
Moderating economic growth triggers construction forecast downgrade for 2017 and 2018
Prospects for the construction industry have weakened with developments over the first half of the year.

Industry Research | Jul 6, 2017
The four types of strategic real estate amenities
From swimming pools to pirate ships, amenities (even crazy ones) aren’t just perks, but assets to enhance performance.
Market Data | Jun 29, 2017
Silicon Valley, Long Island among the priciest places for office fitouts
Coming out on top as the most expensive market to build out an office is Silicon Valley, Calif., with an out-of-pocket cost of $199.22.

Market Data | Jun 26, 2017
Construction disputes were slightly less contentious last year
But poorly written and administered contracts are still problems, says latest Arcadis report.

Industry Research | Jun 26, 2017
Time to earn an architecture license continues to drop
This trend is driven by candidates completing the experience and examination programs concurrently and more quickly.

Industry Research | Jun 22, 2017
ABC's Construction Backlog Indicator rebounds in 2017
The first quarter showed gains in all categories.


