

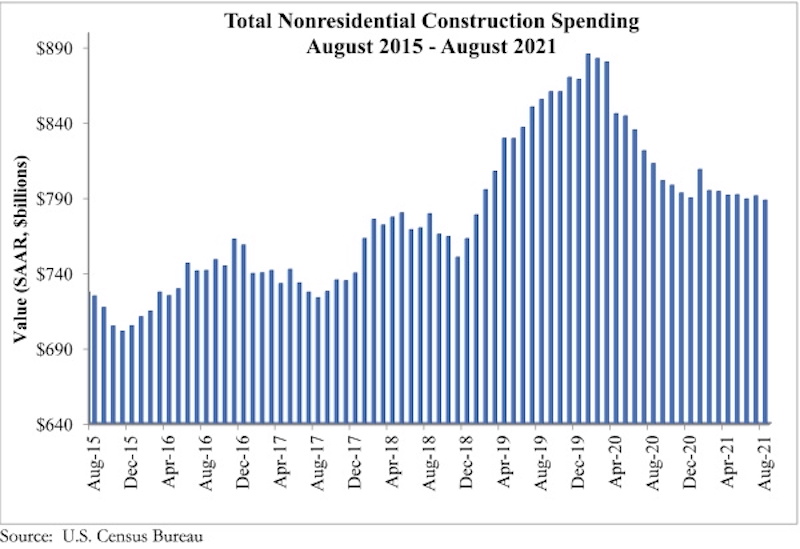
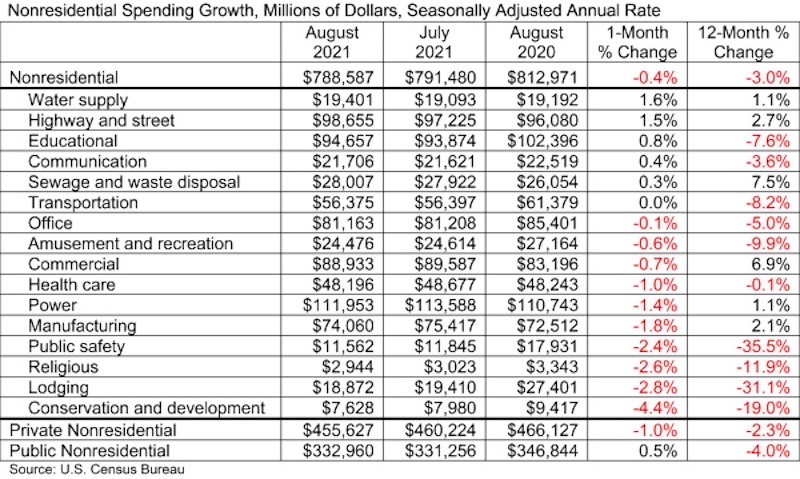
National nonresidential construction spending fell 0.4% in August, according to an Associated Builders and Contractors analysis of data published today by the U.S. Census Bureau. Nonresidential spending totaled $788.6 billion in August on a seasonally adjusted annualized basis, down 3.0% from August 2020.
Spending declined on a monthly basis in 10 of the 16 nonresidential subcategories, with spending in transportation unchanged for the month. Private nonresidential spending was down 1.0%, while public nonresidential construction spending rose 0.5% in August.
“The nonresidential construction spending data are among the most interesting to monitor as the economy continues to wrestle with COVID-19, supply chain disruptions and rampant uncertainty regarding the direction of federal policymaking,” said ABC Chief Economist Anirban Basu. “First, nonresidential construction spending dynamics are shaped by all of the major forces shaping economic outcomes today, including labor shortages, surging input prices, massive liquidity and wavering confidence.
“Second, despite the many challenges they have faced, contractors continued to express confidence regarding near-term prospects until recently, per ABC’s Construction Confidence Index,” said Basu. “For economists, who have been focused on phenomena such as the growing volatility of asset prices, rising freight costs, ongoing lockdowns in parts of the global economy and still-high infection rates in America, that expression of abundant confidence has been somewhat surprising. Today’s data release reminds us that challenges abound, with the trajectory of the nonresidential segment remaining on a downward trend that has now been in place for many months.
“Third, a growing number of contractors indicate that the combination of increasingly expensive labor and rising materials prices are inducing more project owners to postpone work,” said Basu. “This has manifested itself in a number of ways, including the inability of nonresidential construction spending to achieve growth and a recent decline in backlog, as measured by ABC’s Construction Backlog Indicator. As if this were not enough, a bipartisan infrastructure package that appeared set to pass is now jeopardized by jumbled political dynamics.”

Related Stories

Industry Research | Jul 6, 2017
The four types of strategic real estate amenities
From swimming pools to pirate ships, amenities (even crazy ones) aren’t just perks, but assets to enhance performance.
Market Data | Jun 29, 2017
Silicon Valley, Long Island among the priciest places for office fitouts
Coming out on top as the most expensive market to build out an office is Silicon Valley, Calif., with an out-of-pocket cost of $199.22.

Market Data | Jun 26, 2017
Construction disputes were slightly less contentious last year
But poorly written and administered contracts are still problems, says latest Arcadis report.

Industry Research | Jun 26, 2017
Time to earn an architecture license continues to drop
This trend is driven by candidates completing the experience and examination programs concurrently and more quickly.

Industry Research | Jun 22, 2017
ABC's Construction Backlog Indicator rebounds in 2017
The first quarter showed gains in all categories.

Market Data | Jun 21, 2017
Design billings maintain solid footing, strong momentum reflected in project inquiries/design contracts
Balanced growth results in billings gains in all sectors.

Market Data | Jun 16, 2017
Residential construction was strong, but not enough, in 2016
The Joint Center for Housing Studies’ latest report expects minorities and millennials to account for the lion’s share of household formations through 2035.

Industry Research | Jun 15, 2017
Commercial Construction Index indicates high revenue and employment expectations for 2017
USG Corporation (USG) and U.S. Chamber of Commerce release survey results gauging confidence among industry leaders.

Market Data | Jun 2, 2017
Nonresidential construction spending falls in 13 of 16 segments in April
Nonresidential construction spending fell 1.7% in April 2017, totaling $696.3 billion on a seasonally adjusted, annualized basis, according to analysis of U.S. Census Bureau data released today by Associated Builders and Contractors.

Industry Research | May 25, 2017
Project labor agreement mandates inflate cost of construction 13%
Ohio schools built under government-mandated project labor agreements (PLAs) cost 13.12 percent more than schools that were bid and constructed through fair and open competition.


