

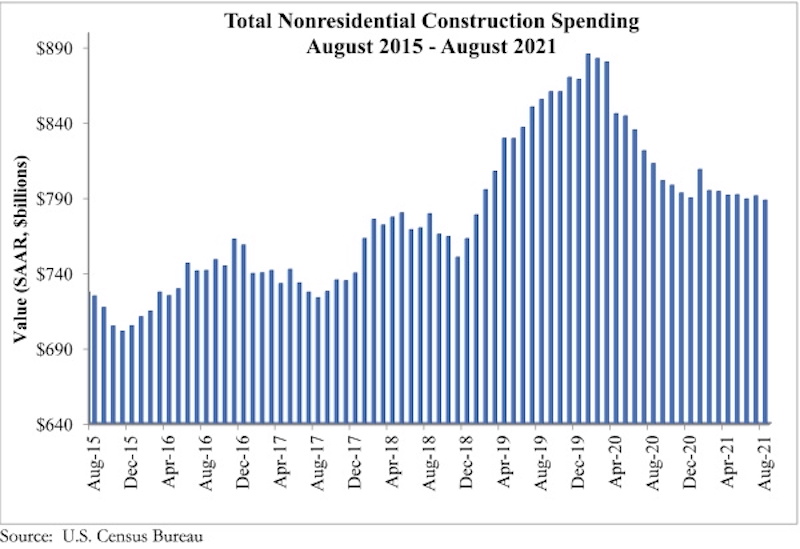
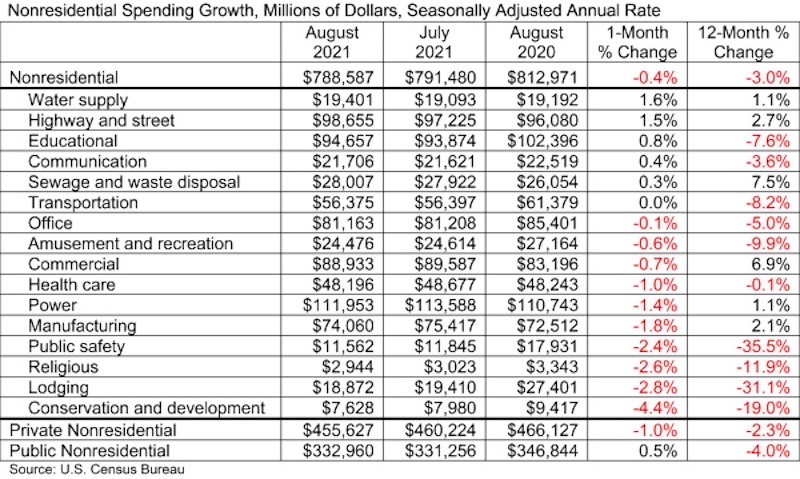
National nonresidential construction spending fell 0.4% in August, according to an Associated Builders and Contractors analysis of data published today by the U.S. Census Bureau. Nonresidential spending totaled $788.6 billion in August on a seasonally adjusted annualized basis, down 3.0% from August 2020.
Spending declined on a monthly basis in 10 of the 16 nonresidential subcategories, with spending in transportation unchanged for the month. Private nonresidential spending was down 1.0%, while public nonresidential construction spending rose 0.5% in August.
“The nonresidential construction spending data are among the most interesting to monitor as the economy continues to wrestle with COVID-19, supply chain disruptions and rampant uncertainty regarding the direction of federal policymaking,” said ABC Chief Economist Anirban Basu. “First, nonresidential construction spending dynamics are shaped by all of the major forces shaping economic outcomes today, including labor shortages, surging input prices, massive liquidity and wavering confidence.
“Second, despite the many challenges they have faced, contractors continued to express confidence regarding near-term prospects until recently, per ABC’s Construction Confidence Index,” said Basu. “For economists, who have been focused on phenomena such as the growing volatility of asset prices, rising freight costs, ongoing lockdowns in parts of the global economy and still-high infection rates in America, that expression of abundant confidence has been somewhat surprising. Today’s data release reminds us that challenges abound, with the trajectory of the nonresidential segment remaining on a downward trend that has now been in place for many months.
“Third, a growing number of contractors indicate that the combination of increasingly expensive labor and rising materials prices are inducing more project owners to postpone work,” said Basu. “This has manifested itself in a number of ways, including the inability of nonresidential construction spending to achieve growth and a recent decline in backlog, as measured by ABC’s Construction Backlog Indicator. As if this were not enough, a bipartisan infrastructure package that appeared set to pass is now jeopardized by jumbled political dynamics.”

Related Stories

Industry Research | Apr 28, 2017
A/E Industry lacks planning, but still spending large on hiring
The average 200-person A/E Firm is spending $200,000 on hiring, and not budgeting at all.

Market Data | Apr 19, 2017
Architecture Billings Index continues to strengthen
Balanced growth results in billings gains in all regions.

Market Data | Apr 13, 2017
2016’s top 10 states for commercial development
Three new states creep into the top 10 while first and second place remain unchanged.

Market Data | Apr 6, 2017
Architecture marketing: 5 tools to measure success
We’ve identified five architecture marketing tools that will help your firm evaluate if it’s on the track to more leads, higher growth, and broader brand visibility.

Market Data | Apr 3, 2017
Public nonresidential construction spending rebounds; overall spending unchanged in February
The segment totaled $701.9 billion on a seasonally adjusted annualized rate for the month, marking the seventh consecutive month in which nonresidential spending sat above the $700 billion threshold.

Market Data | Mar 29, 2017
Contractor confidence ends 2016 down but still in positive territory
Although all three diffusion indices in the survey fell by more than five points they remain well above the threshold of 50, which signals that construction activity will continue to be one of the few significant drivers of economic growth.

Market Data | Mar 24, 2017
These are the most and least innovative states for 2017
Connecticut, Virginia, and Maryland are all in the top 10 most innovative states, but none of them were able to claim the number one spot.

Market Data | Mar 22, 2017
After a strong year, construction industry anxious about Washington’s proposed policy shifts
Impacts on labor and materials costs at issue, according to latest JLL report.

Market Data | Mar 22, 2017
Architecture Billings Index rebounds into positive territory
Business conditions projected to solidify moving into the spring and summer.

Market Data | Mar 15, 2017
ABC's Construction Backlog Indicator fell to end 2016
Contractors in each segment surveyed all saw lower backlog during the fourth quarter, with firms in the heavy industrial segment experiencing the largest drop.


