

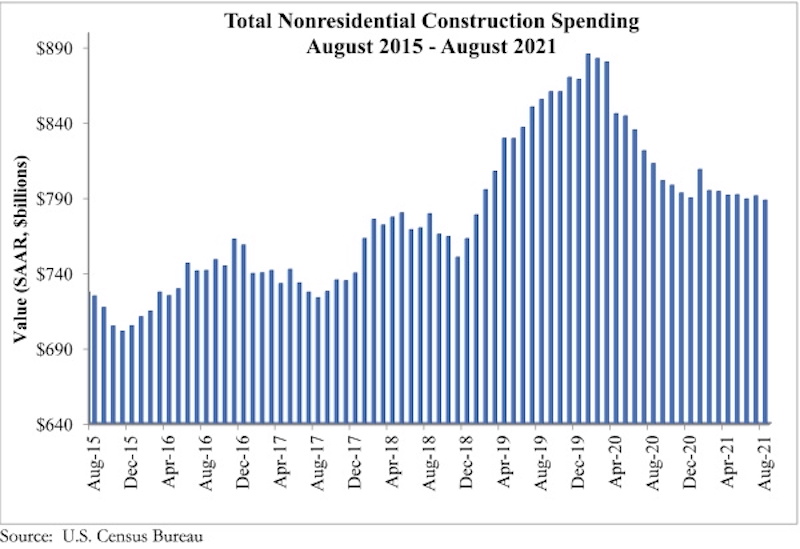
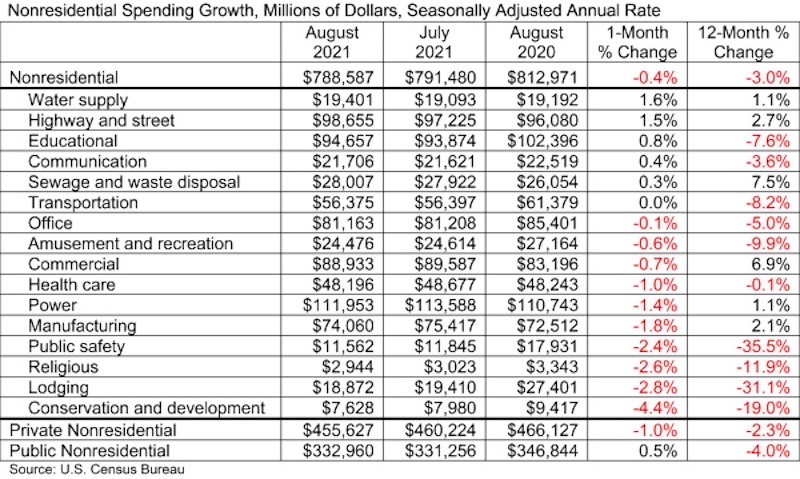
National nonresidential construction spending fell 0.4% in August, according to an Associated Builders and Contractors analysis of data published today by the U.S. Census Bureau. Nonresidential spending totaled $788.6 billion in August on a seasonally adjusted annualized basis, down 3.0% from August 2020.
Spending declined on a monthly basis in 10 of the 16 nonresidential subcategories, with spending in transportation unchanged for the month. Private nonresidential spending was down 1.0%, while public nonresidential construction spending rose 0.5% in August.
“The nonresidential construction spending data are among the most interesting to monitor as the economy continues to wrestle with COVID-19, supply chain disruptions and rampant uncertainty regarding the direction of federal policymaking,” said ABC Chief Economist Anirban Basu. “First, nonresidential construction spending dynamics are shaped by all of the major forces shaping economic outcomes today, including labor shortages, surging input prices, massive liquidity and wavering confidence.
“Second, despite the many challenges they have faced, contractors continued to express confidence regarding near-term prospects until recently, per ABC’s Construction Confidence Index,” said Basu. “For economists, who have been focused on phenomena such as the growing volatility of asset prices, rising freight costs, ongoing lockdowns in parts of the global economy and still-high infection rates in America, that expression of abundant confidence has been somewhat surprising. Today’s data release reminds us that challenges abound, with the trajectory of the nonresidential segment remaining on a downward trend that has now been in place for many months.
“Third, a growing number of contractors indicate that the combination of increasingly expensive labor and rising materials prices are inducing more project owners to postpone work,” said Basu. “This has manifested itself in a number of ways, including the inability of nonresidential construction spending to achieve growth and a recent decline in backlog, as measured by ABC’s Construction Backlog Indicator. As if this were not enough, a bipartisan infrastructure package that appeared set to pass is now jeopardized by jumbled political dynamics.”

Related Stories

Market Data | Jan 29, 2018
Year-end data show economy expanded in 2017; Fixed investment surged in fourth quarter
The economy expanded at an annual rate of 2.6% during the fourth quarter of 2017.

Market Data | Jan 25, 2018
Renters are the majority in 42 U.S. cities
Over the past 10 years, the number of renters has increased by 23 million.

Market Data | Jan 24, 2018
HomeUnion names the most and least affordable rental housing markets
Chicago tops the list as the most affordable U.S. metro, while Oakland, Calif., is the most expensive rental market.

Market Data | Jan 12, 2018
Construction input prices inch down in December, Up YOY despite low inflation
Energy prices have been more volatile lately.

Market Data | Jan 4, 2018
Nonresidential construction spending ticks higher in November, down year-over-year
Despite the month-over-month expansion, nonresidential spending fell 1.3 percent from November 2016.

Contractors | Jan 4, 2018
Construction spending in a ‘mature’ period of incremental growth
Labor shortages are spiking wages. Materials costs are rising, too.
 reported the November ABI score was 55.0, up from a score of 51.7 in the previous month. Photo: Pixabay")
Market Data | Dec 20, 2017
Architecture billings upturn shows broad strength
The American Institute of Architects (AIA) reported the November ABI score was 55.0, up from a score of 51.7 in the previous month.

Market Data | Dec 14, 2017
ABC chief economist predicts stable 2018 construction economy
There are risks to the 2018 outlook as a number of potential cost increases could come into play.

Market Data | Dec 13, 2017
Top world regions and markets in the global hotel construction pipeline
The top world region by project count is North America.

Market Data | Dec 11, 2017
Global hotel construction pipeline is growing
The Total Pipeline stands at 12,427 Projects/2,084,940 Rooms.


