

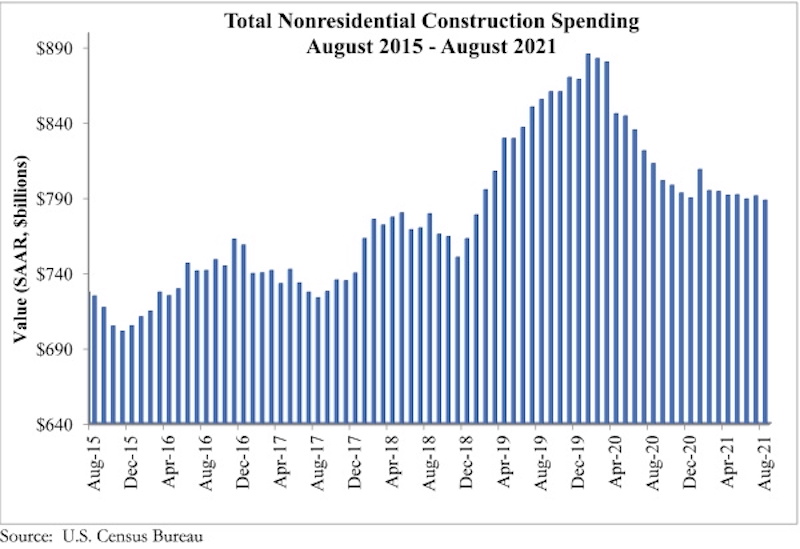
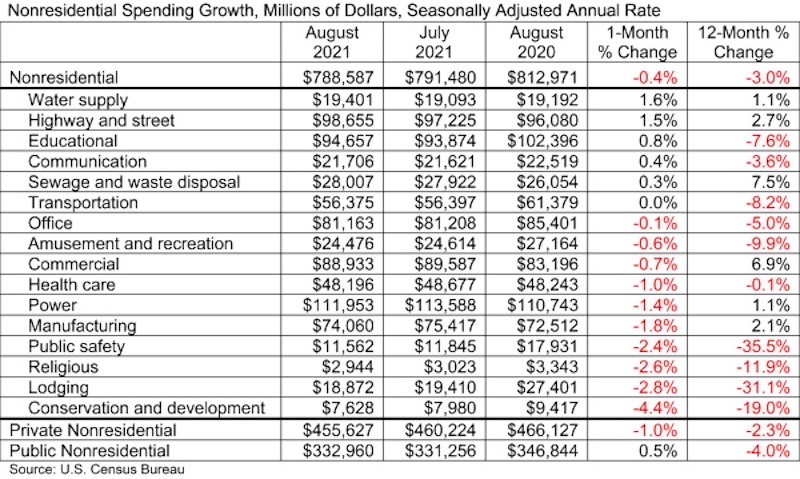
National nonresidential construction spending fell 0.4% in August, according to an Associated Builders and Contractors analysis of data published today by the U.S. Census Bureau. Nonresidential spending totaled $788.6 billion in August on a seasonally adjusted annualized basis, down 3.0% from August 2020.
Spending declined on a monthly basis in 10 of the 16 nonresidential subcategories, with spending in transportation unchanged for the month. Private nonresidential spending was down 1.0%, while public nonresidential construction spending rose 0.5% in August.
“The nonresidential construction spending data are among the most interesting to monitor as the economy continues to wrestle with COVID-19, supply chain disruptions and rampant uncertainty regarding the direction of federal policymaking,” said ABC Chief Economist Anirban Basu. “First, nonresidential construction spending dynamics are shaped by all of the major forces shaping economic outcomes today, including labor shortages, surging input prices, massive liquidity and wavering confidence.
“Second, despite the many challenges they have faced, contractors continued to express confidence regarding near-term prospects until recently, per ABC’s Construction Confidence Index,” said Basu. “For economists, who have been focused on phenomena such as the growing volatility of asset prices, rising freight costs, ongoing lockdowns in parts of the global economy and still-high infection rates in America, that expression of abundant confidence has been somewhat surprising. Today’s data release reminds us that challenges abound, with the trajectory of the nonresidential segment remaining on a downward trend that has now been in place for many months.
“Third, a growing number of contractors indicate that the combination of increasingly expensive labor and rising materials prices are inducing more project owners to postpone work,” said Basu. “This has manifested itself in a number of ways, including the inability of nonresidential construction spending to achieve growth and a recent decline in backlog, as measured by ABC’s Construction Backlog Indicator. As if this were not enough, a bipartisan infrastructure package that appeared set to pass is now jeopardized by jumbled political dynamics.”

Related Stories

Market Data | Mar 8, 2018
Prioritizing your marketing initiatives
It’s time to take a comprehensive look at your plans and figure out the best way to get from Point A to Point B.

Market Data | Mar 6, 2018
Persistent workforce shortages challenge commercial construction industry as U.S. building demands continue to grow
To increase jobsite efficiency and improve labor productivity, increasingly more builders are turning to alternative construction solutions.
Market Data | Mar 2, 2018
Nonresidential construction spending dips slightly in January
Private nonresidential construction fell 1.5% for the month, while public sector nonresidential spending increased 1.9%.
Market Data | Feb 27, 2018
AIA small firm report: Half of employees have ownership stake in their firm
The American Institute of Architects has released its first-ever Small Firm Compensation Report.

Market Data | Feb 21, 2018
Strong start for architecture billings in 2018
The American Institute of Architects reported the January 2018 ABI score was 54.7, up from a score of 52.8 in the previous month.
Multifamily Housing | Feb 15, 2018
United States ranks fourth for renter growth
Renters are on the rise in 21 of the 30 countries examined in RentCafé’s recent study.

Market Data | Feb 1, 2018
Nonresidential construction spending expanded 0.8% in December, brighter days ahead
“The tax cut will further bolster liquidity and confidence, which will ultimately translate into more construction starts and spending,” said ABC Chief Economist Anirban Basu.
Green | Jan 31, 2018
U.S. Green Building Council releases annual top 10 states for LEED green building per capita
Massachusetts tops the list for the second year; New York, Hawaii and Illinois showcase leadership in geographically diverse locations.

Industry Research | Jan 30, 2018
AIA’s Kermit Baker: Five signs of an impending upturn in construction spending
Tax reform implications and rebuilding from natural disasters are among the reasons AIA’s Chief Economist is optimistic for 2018 and 2019.

Market Data | Jan 30, 2018
AIA Consensus Forecast: 4.0% growth for nonresidential construction spending in 2018
The commercial office and retail sectors will lead the way in 2018, with a strong bounce back for education and healthcare.


