

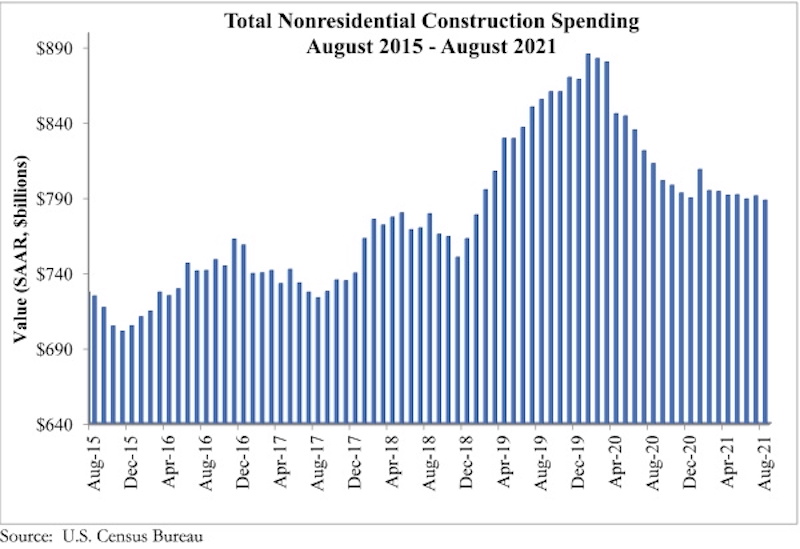
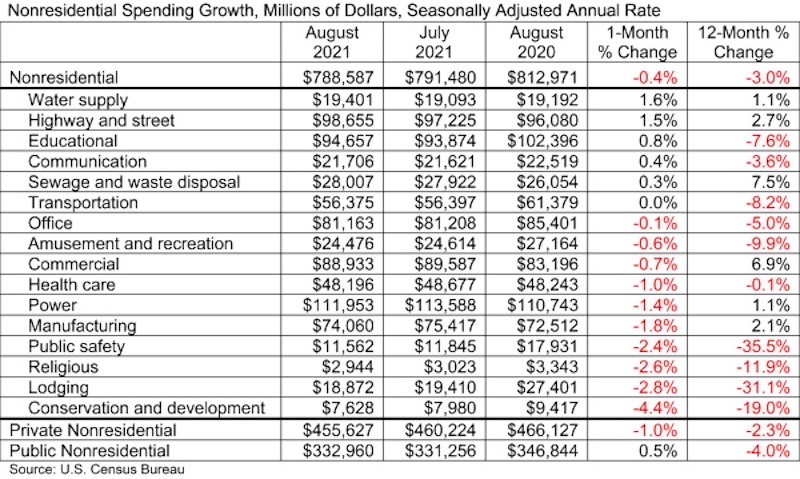
National nonresidential construction spending fell 0.4% in August, according to an Associated Builders and Contractors analysis of data published today by the U.S. Census Bureau. Nonresidential spending totaled $788.6 billion in August on a seasonally adjusted annualized basis, down 3.0% from August 2020.
Spending declined on a monthly basis in 10 of the 16 nonresidential subcategories, with spending in transportation unchanged for the month. Private nonresidential spending was down 1.0%, while public nonresidential construction spending rose 0.5% in August.
“The nonresidential construction spending data are among the most interesting to monitor as the economy continues to wrestle with COVID-19, supply chain disruptions and rampant uncertainty regarding the direction of federal policymaking,” said ABC Chief Economist Anirban Basu. “First, nonresidential construction spending dynamics are shaped by all of the major forces shaping economic outcomes today, including labor shortages, surging input prices, massive liquidity and wavering confidence.
“Second, despite the many challenges they have faced, contractors continued to express confidence regarding near-term prospects until recently, per ABC’s Construction Confidence Index,” said Basu. “For economists, who have been focused on phenomena such as the growing volatility of asset prices, rising freight costs, ongoing lockdowns in parts of the global economy and still-high infection rates in America, that expression of abundant confidence has been somewhat surprising. Today’s data release reminds us that challenges abound, with the trajectory of the nonresidential segment remaining on a downward trend that has now been in place for many months.
“Third, a growing number of contractors indicate that the combination of increasingly expensive labor and rising materials prices are inducing more project owners to postpone work,” said Basu. “This has manifested itself in a number of ways, including the inability of nonresidential construction spending to achieve growth and a recent decline in backlog, as measured by ABC’s Construction Backlog Indicator. As if this were not enough, a bipartisan infrastructure package that appeared set to pass is now jeopardized by jumbled political dynamics.”

Related Stories
Market Data | Apr 4, 2018
Construction employment increases in 257 metro areas between February 2017 & 2018 as construction firms continue to expand amid strong demand
Riverside-San Bernardino-Ontario, Calif. and Merced, Calif. experience largest year-over-year gains; Baton Rouge, La. and Auburn-Opelika, Ala. have biggest annual declines in construction employment.
Market Data | Apr 2, 2018
Construction spending in February inches up from January
Association officials urge federal, state and local officials to work quickly to put recently enacted funding increases to work to improve aging and over-burdened infrastructure, offset public-sector spending drops.

Market Data | Mar 29, 2018
AIA and the University of Minnesota partner to develop Guides for Equitable Practice
The Guides for Equitable Practice will be developed and implemented in three phase.

Market Data | Mar 22, 2018
Architecture billings continue to hold positive in 2018
Billings particularly strong at firms in the West and Midwest regions.

Market Data | Mar 21, 2018
Construction employment increases in 248 metro areas as new metal tariffs threaten future sector job gains
Riverside-San Bernardino-Ontario, Calif., and Merced, Calif., experience largest year-over-year gains; Baton Rouge, La., and Auburn-Opelika, Ala., have biggest annual declines in construction employment.
Market Data | Mar 19, 2018
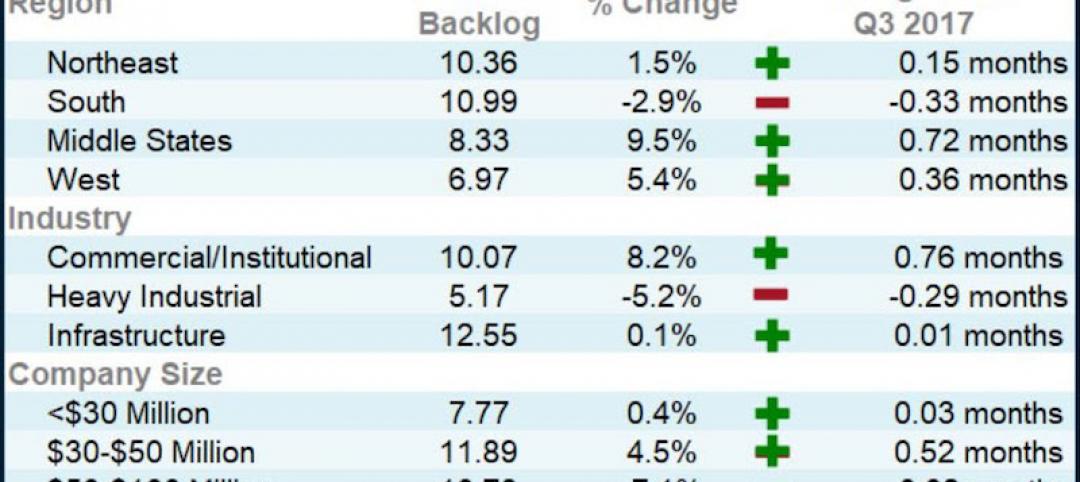
ABC's Construction Backlog Indicator hits a new high: 2018 poised to be a very strong year for construction spending
CBI is up by 1.36 months, or 16.3%, on a year-over-year basis.

Market Data | Mar 15, 2018
ABC: Construction materials prices continue to expand briskly in February
Compared to February 2017, prices are up 5.2%.

Market Data | Mar 14, 2018
AGC: Tariff increases threaten to make many project unaffordable
Construction costs escalated in February, driven by price increases for a wide range of building materials, including steel and aluminum.
Market Data | Mar 12, 2018
Construction employers add 61,000 jobs in February and 254,000 over the year
Hourly earnings rise 3.3% as sector strives to draw in new workers.

Steel Buildings | Mar 9, 2018
New steel and aluminum tariffs will hurt construction firms by raising materials costs; potential trade war will dampen demand, says AGC of America
Independent studies suggest the construction industry could lose nearly 30,000 jobs as a result of administration's new tariffs as many firms will be forced to absorb increased costs.


