


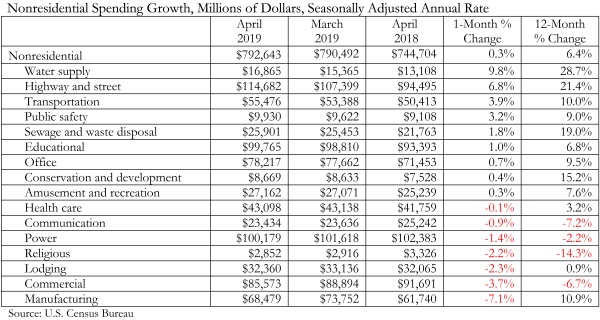
According to an Associated Builders and Contractors analysis of U.S. Census Bureau data released today, national nonresidential construction spending rose 0.3% in April, totaling $792.6 billion on a seasonally adjusted annualized basis, which is a 6.4% increase compared to the same time last year. While public nonresidential spending expanded 4.8% on a monthly basis and increased 15.4% since April 2018, private nonresidential spending fell 2.9% in April and is up just 0.6 % year-over-year.
Among the 16 nonresidential construction spending categories, nine experienced an increase in monthly spending, with the largest increases registered in water supply (9.8%), highway and street (6.8%) and transportation (3.9%). Manufacturing (-7.1%) and commercial (-3.7%) experienced the largest decreases in April, though manufacturing spending is still up 10.9% compared to the same time last year.
“Today’s data release shows that nonresidential construction spending remains vigorous in America,” said ABC Chief Economist Anirban Basu. “While April’s monthly nonresidential construction spending growth of 0.3 percent appears lackluster, this was largely the result of a sizeable upward revision to March construction spending figures.
“Today’s data release also indicates that the baton has now been fully passed,” said Basu. “Earlier in the recovery, nonresidential construction spending growth was primarily driven by private segments. Low interest rates and abundant liquidity helped fuel private investment in hotels, data centers, casinos, fulfillment centers and other forms of private construction. But over the past year, private nonresidential construction spending has barely budged. Meanwhile, public residential spending is up 15.4 percent and April’s spending growth was led by water supply and highway/street.
“Given current levels of backlog, which expanded to 9.5 months in March 2019, nonresidential construction spending should remain elevated,” said Basu. “That said, risks of recession in 2020 are rapidly rising, which has the potential to reduce construction activity in 2021 and/or 2022.”
Related Stories

K-12 Schools | Feb 29, 2024
Average age of U.S. school buildings is just under 50 years
The average age of a main instructional school building in the United States is 49 years, according to a survey by the National Center for Education Statistics (NCES). About 38% of schools were built before 1970. Roughly half of the schools surveyed have undergone a major building renovation or addition.

MFPRO+ Research | Feb 27, 2024
Most competitive rental markets of early 2024
The U.S. rental market in early 2024 is moderately competitive, with apartments taking an average of 41 days to find tenants, according to the latest RentCafe Market Competitivity Report.

Construction Costs | Feb 22, 2024
K-12 school construction costs for 2024
Data from Gordian breaks down the average cost per square foot for four different types of K-12 school buildings (elementary schools, junior high schools, high schools, and vocational schools) across 10 U.S. cities.

Student Housing | Feb 21, 2024
Student housing preleasing continues to grow at record pace
Student housing preleasing continues to be robust even as rent growth has decelerated, according to the latest Yardi Matrix National Student Housing Report.

Architects | Feb 21, 2024
Architecture Billings Index remains in 'declining billings' state in January 2024
Architecture firm billings remained soft entering into 2024, with an AIA/Deltek Architecture Billings Index (ABI) score of 46.2 in January. Any score below 50.0 indicates decreasing business conditions.

Multifamily Housing | Feb 14, 2024
Multifamily rent remains flat at $1,710 in January
The multifamily market was stable at the start of 2024, despite the pressure of a supply boom in some markets, according to the latest Yardi Matrix National Multifamily Report.

Student Housing | Feb 13, 2024
Student housing market expected to improve in 2024
The past year has brought tough times for student housing investment sales due to unfavorable debt markets. However, 2024 offers a brighter outlook if debt conditions improve as predicted.

Contractors | Feb 13, 2024
The average U.S. contractor has 8.4 months worth of construction work in the pipeline, as of January 2024
Associated Builders and Contractors reported today that its Construction Backlog Indicator declined to 8.4 months in January, according to an ABC member survey conducted from Jan. 22 to Feb. 4. The reading is down 0.6 months from January 2023.
Industry Research | Feb 8, 2024
New multifamily development in 2023 exceeded expectations
Despite a problematic financing environment, 2023 multifamily construction starts held up “remarkably well” according to the latest Yardi Matrix report.

Market Data | Feb 7, 2024
New download: BD+C's February 2024 Market Intelligence Report
Building Design+Construction's monthly Market Intelligence Report offers a snapshot of the health of the U.S. building construction industry, including the commercial, multifamily, institutional, and industrial building sectors. This report tracks the latest metrics related to construction spending, demand for design services, contractor backlogs, and material price trends.


