

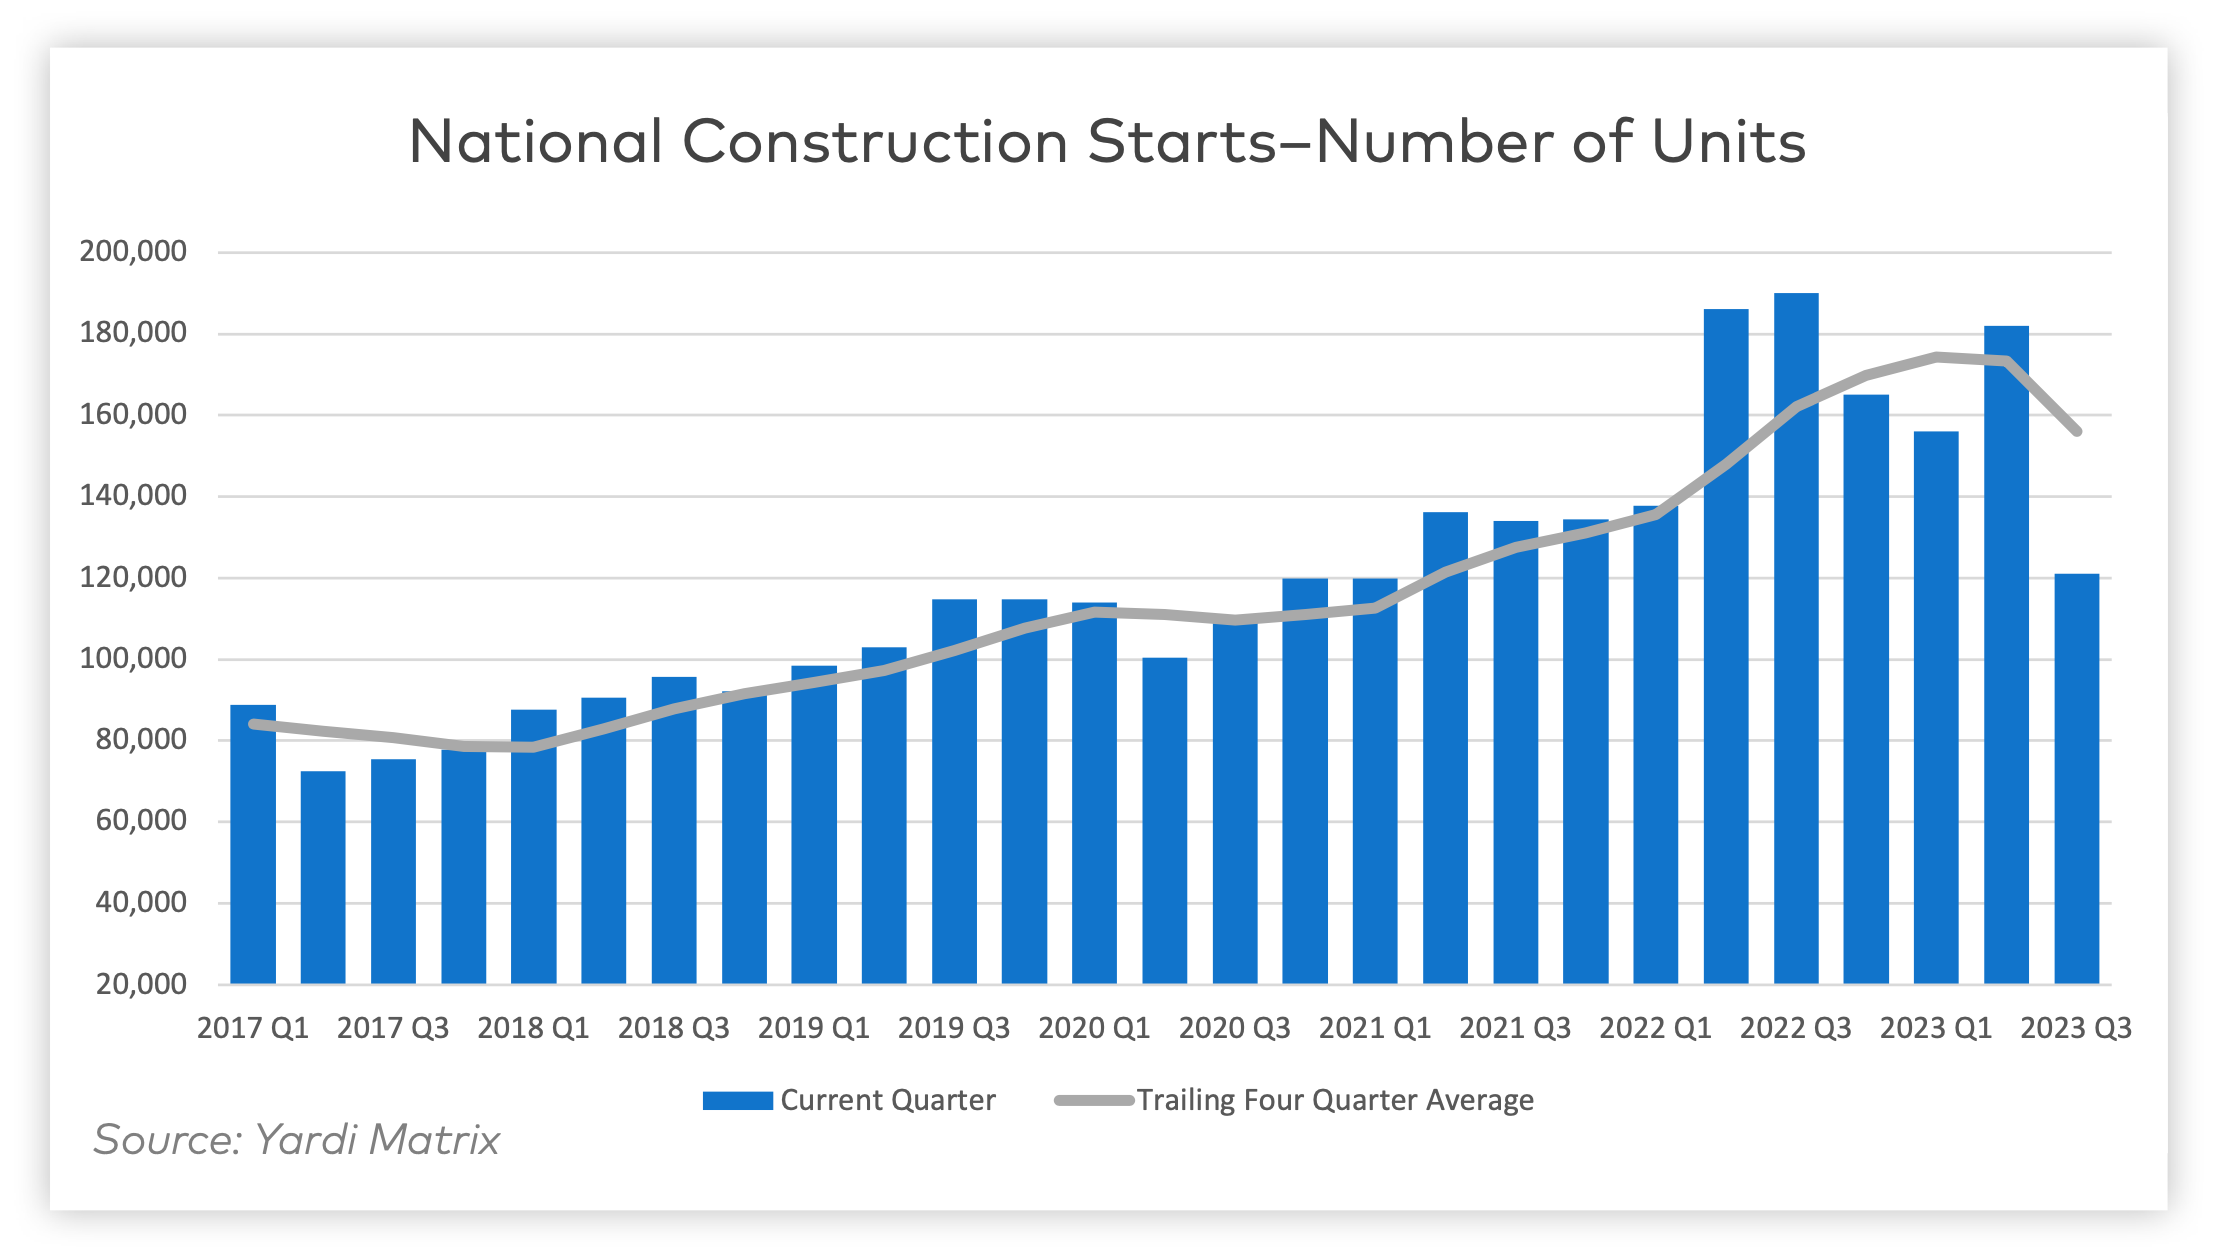
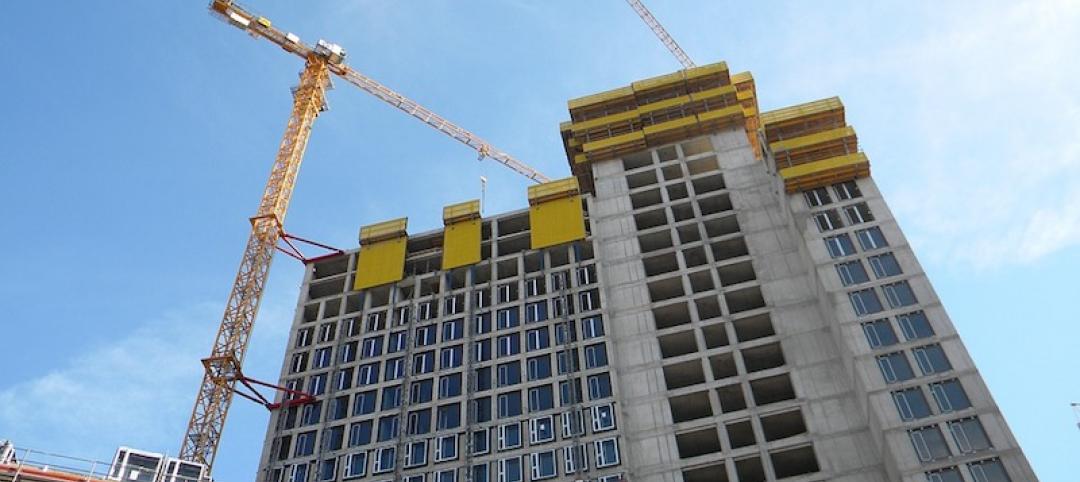
Despite a problematic financing environment, 2023 multifamily construction starts held up “remarkably well” according to the latest Yardi Matrix report. The data from 2023—albeit incomplete—shows that 506,742 units began construction. This figure ranks third for new construction starts even without the complete full year's data.
Yardi’s biggest takeaway is that multifamily development in 2023 exceeded initial expectations. This was driven in part by a “stronger-than-expected” Q1 and Q2, as well as an influx of affordable and single-family rental housing.
New Multifamily Development Insights
These are three insights from the Yardi Matrix Multifamily Construction Starts – January 2024 report:
1. Single-family rentals and affordable housing have become increasingly popular
For the last decade, the percentage of market rate multifamily units has declined in favor of other product types. While market rate units comprised 86% of all new multifamily construction starts in 2013, they now make up only 77% of the sector as of last year.
Conversely, affordable housing starts jumped from 8.4% to 13.4% of the total in ten years. Single-family rental increased from 0.9% to 5.8% in the same timeframe.
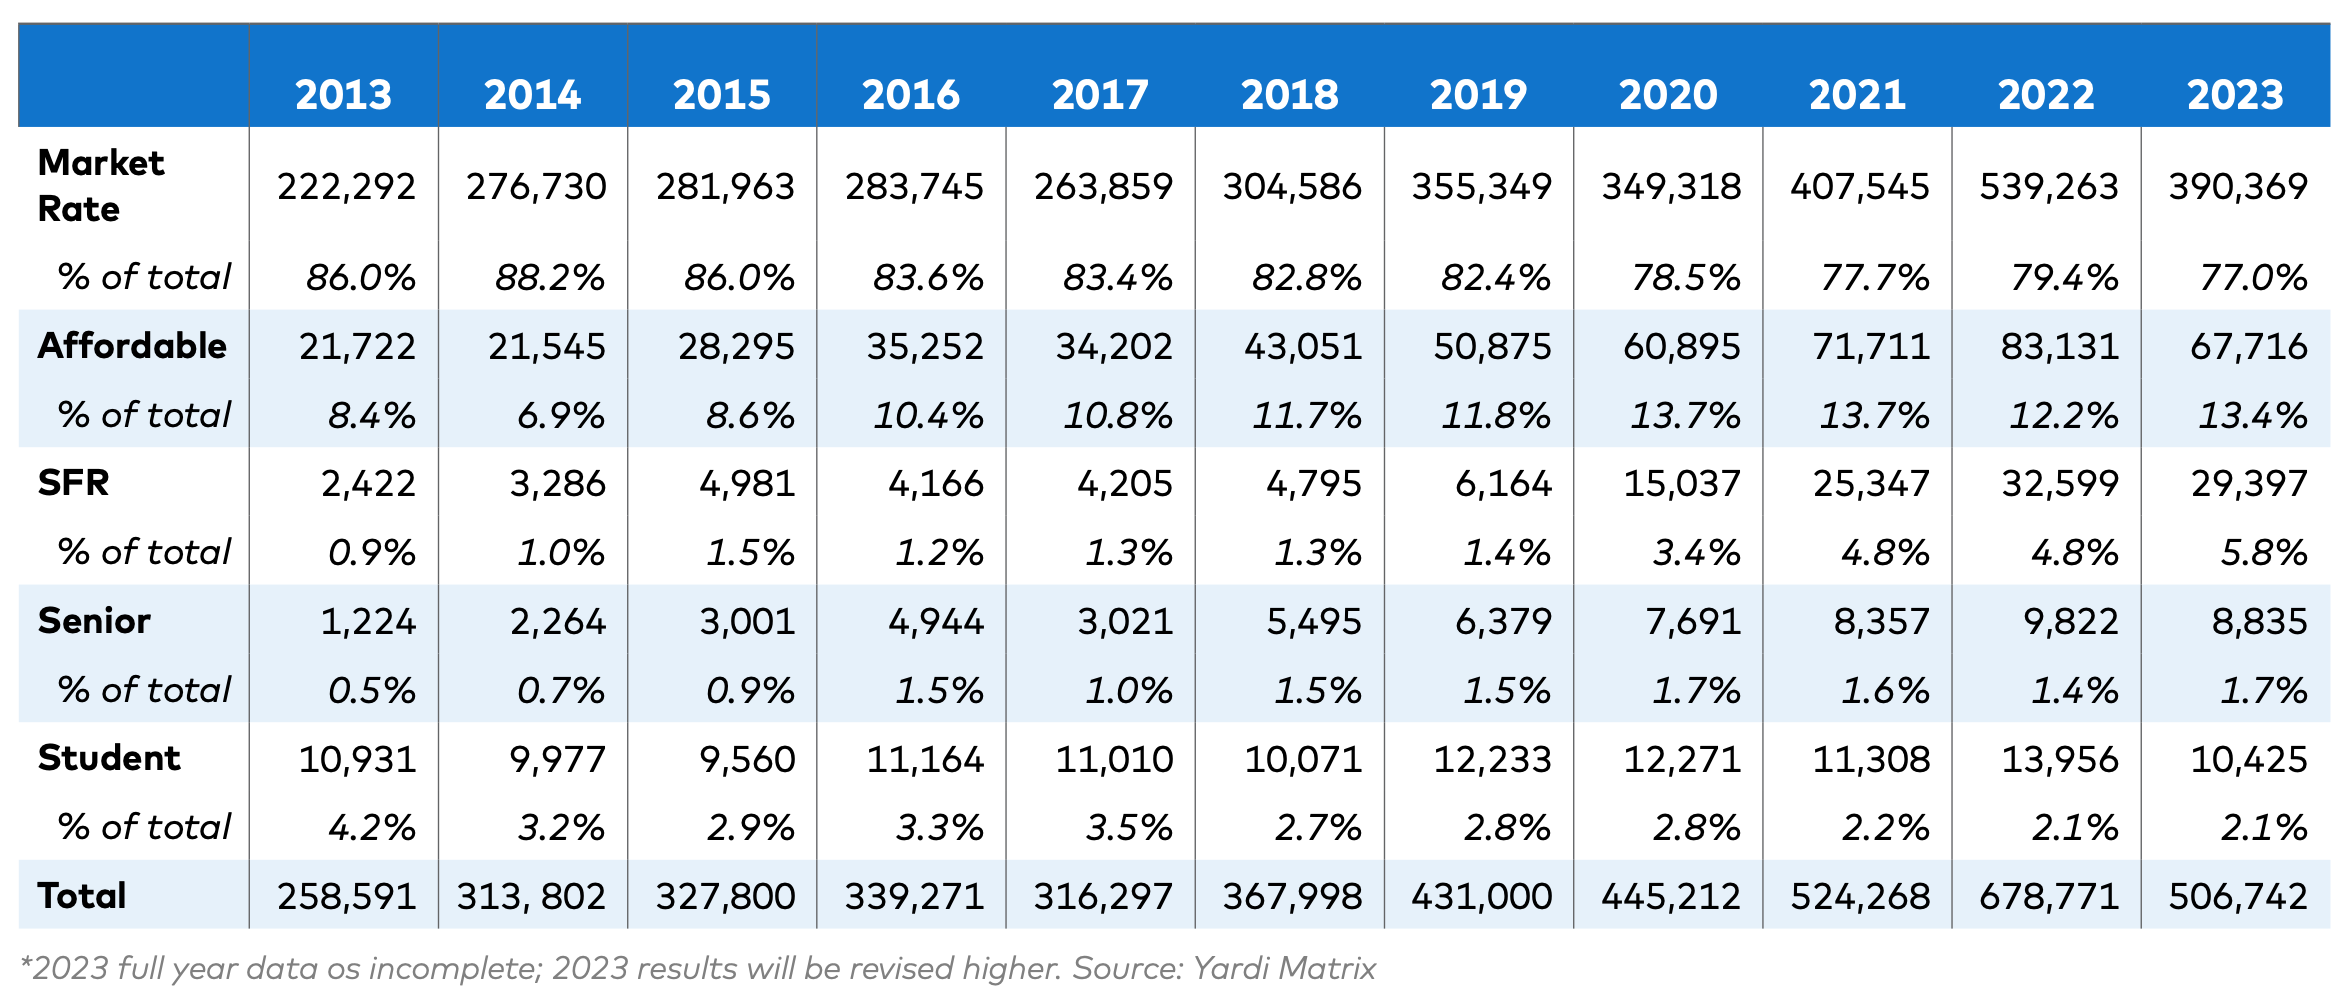
Senior housing has remained largely unchanged since 2013, increasing from 0.5% to 1.7%; student housing has been declining slowly, comprising 4.2% of multifamily construction starts in 2013 to 2.1% in 2023.
2. Markets with high levels of development in 2022 saw substantial declines in new construction starts in 2023
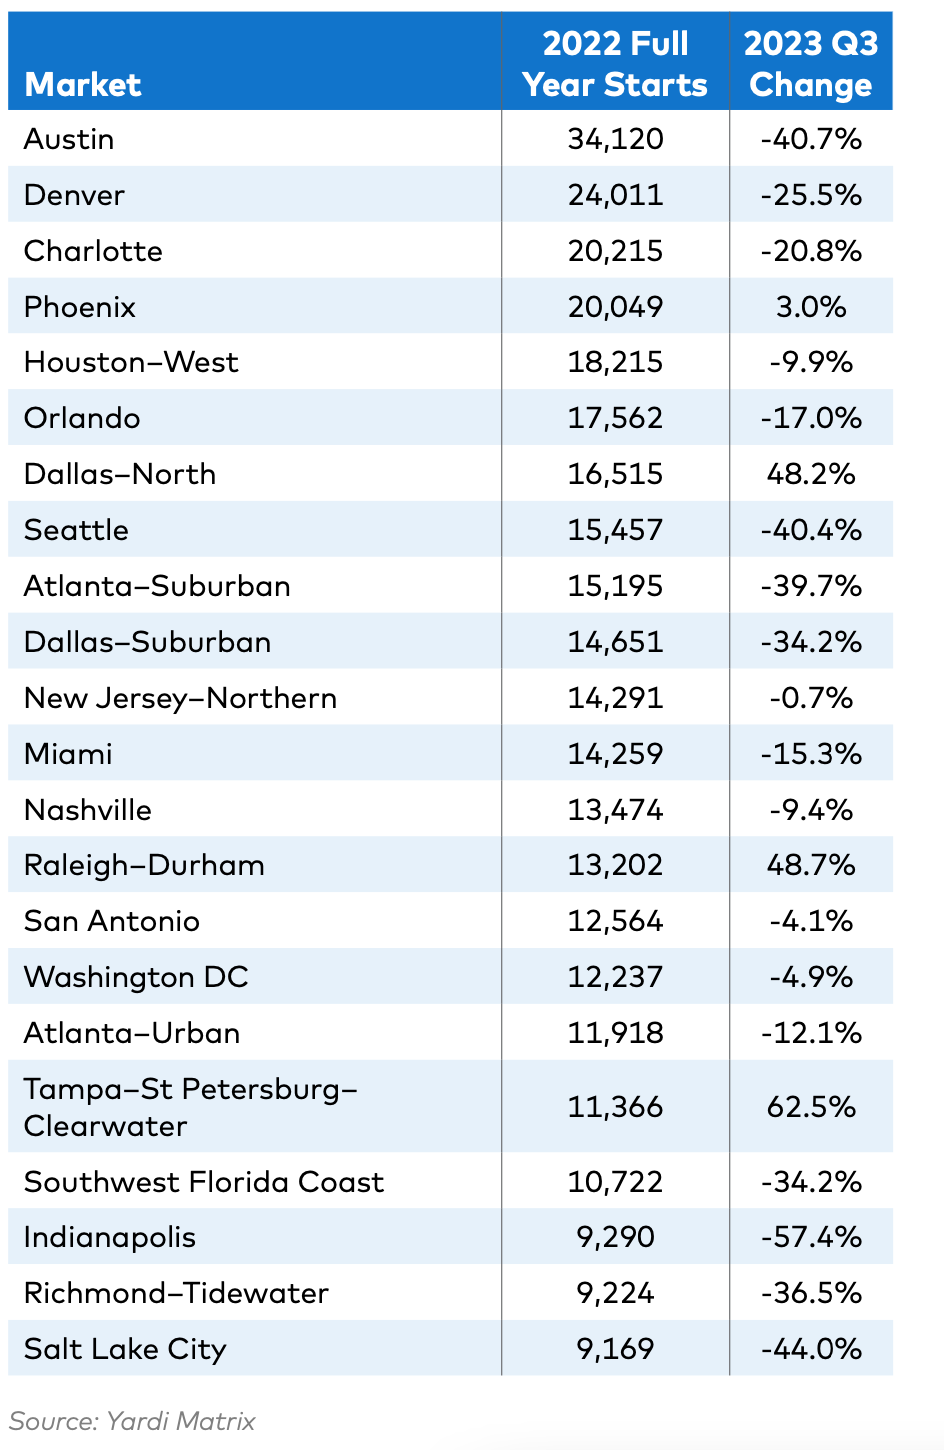
2022 saw 678,771 units start construction, a 29.4% increase over 2021 levels. Half of those were contained in just 22 markets. For the first three quarters of 2023, 18 of those markets saw starts decline compared to the same period in 2022.
Some of the more sizable declines in major metropolitan areas include:
- Salt Lake City, Utah, had a –44% change in multifamily starts from 2022
- Austin, Texas, had a –40.7% change in multifamily starts from 2022
- Seattle, Wash., had a –40.4% change in multifamily starts from 2022
Other markets like Southwest Florida Coast and suburban Atlanta, Dallas, and Denver saw starts decline by 25% or more.
3. Much of 2023’s new-development activity was driven by smaller and midsize markets
 According to the report, markets that did not participate in the post-pandemic development surge were better able to sustain new construction in 2023. These markets tended to be on the smaller size, averaging an increase of 2,161 units over the year.
Just four of the 22 strongest markets in 2022 continued to grow in 2023:
- Phoenix, Ariz., had a 3% growth in multifamily starts
- North Dallas, Texas, had a 48.2% growth in multifamily starts
- Raleigh–Durham, N.C., had a 48.7% growth in multifamily starts
- Tampa–St. Petersburg–Clearwater, Fla., had a 62.5% growth in multifamily starts
Other markets like Boston, Mass., (35%) and Kansas City, Mo., (41%) saw growth as well.
Bottom Line
Though slightly less than expected, new multifamily starts in 2023 are the 3rd highest year ever with 506,742 units. The growth primarily comes from affordable housing, single-family rentals, and smaller/midsize markets.
The decline this year is largely driven by tight financing conditions, and markets with high 2022 activity not being able to keep up. Despite the decline in starts, completions are expected to stay strong in 2024-2025.
Related Stories

Designers | Oct 12, 2016
Perkins Eastman and EwingCole co-publish new white paper examining the benefits and challenges of design research
The survey’s findings, combined with input from the EDRA conference, informed the content produced for “Where Are We Now?”

Market Data | Oct 11, 2016
Building design revenue topped $28 billion in 2015
Growing profitability at architecture firms has led to reinvestment and expansion

Market Data | Oct 4, 2016
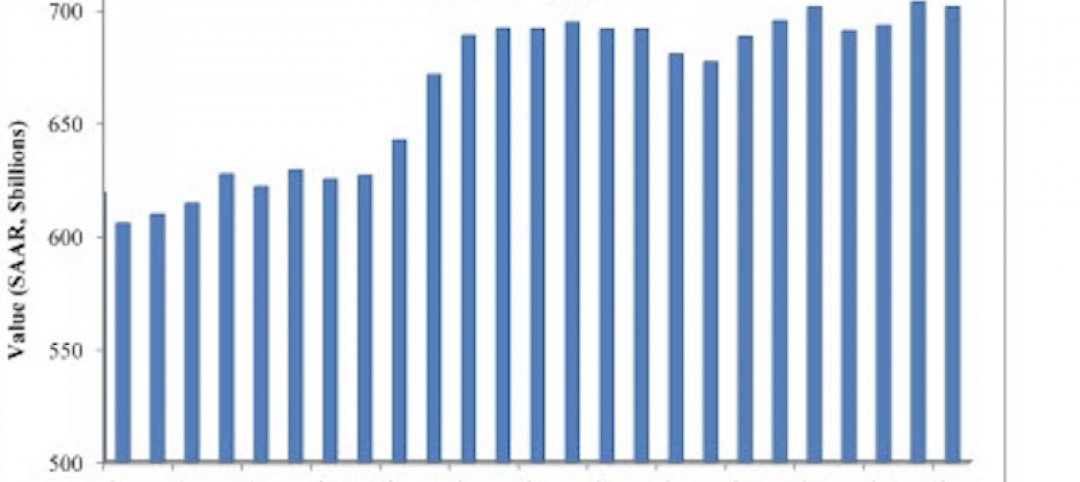
Nonresidential spending slips in August
Public sector spending is declining faster than the private sector.

Industry Research | Oct 3, 2016
Structure Tone survey shows cost is still a major barrier to building green
Climate change, resilience and wellness are also growing concerns.

Industry Research | Sep 28, 2016
Worldwide hotel construction shows modest year-over-year growth
Overall construction for hotel projects is up, but the current number of hotels currently being built has dipped slightly from one year ago.
Industry Research | Sep 27, 2016
Sterling Risk Sentiment Index indicates risk exposure perception remains stable in construction industry
Nearly half (45%) of those polled say election year uncertainty has a negative effect on risk perception in the construction market.
Industry Research | Sep 21, 2016
The global penetration of smart meters is expected to reach approximately 53% by the end of 2025
Large-scale smart meter deployments are underway across Western Europe, while new deployments continue among later adopters in the United States.

Industry Research | Sep 12, 2016
Evidence linking classroom design to improved learning mounts
A study finds the impact can be as much as 25% per year.

Healthcare Facilities | Sep 6, 2016
Chicago Faucets releases white paper: Reducing the risk of HAIs in healthcare facilities
The white paper discusses in detail four options used to mitigate transmission of waterborne bacteria
Market Data | Sep 2, 2016
Nonresidential spending inches lower in July while June data is upwardly revised to eight-year record
Nonresidential construction spending has been suppressed over the last year or so with the primary factor being the lack of momentum in public spending.


