


The National Council of Architectural Registration Boards (NCARB) recently launched its annual data report, NCARB by the Numbers. The 2017 edition provides exclusive insight into the number of U.S. architects, the value of graduating from an accredited program, the time it takes to earn a license, and diversity in the profession.
Key findings from the latest edition, which is based on data from the 2016 calendar year, include:
- Over 8,100 licensure candidates completed the Architectural Experience Program (AXP) in 2016—an all-time high.
- On average, candidates take 4.2 years to complete the AXP.
- Around 4,300 candidates completed the Architect Registration Examination® (AR®) in 2016.
- Graduates from accredited architecture programs finish the ARE about five months sooner than their peers from non-accredited programs.
- Sixty-seven percent of candidates overlap their experience and exams—the largest percentage to date.
- On average, becoming an architect takes 12.5 years—from the time a student enrolls in school to the moment they receive a license. This marks the eighth year in a row the timeline to licensure has decreased.
- The pool of candidates working toward licensure is more diverse than ever before, and 36 percent of newly licensed architects are women.
- In 2016, there were 109,748 architects in the United States—a minimal drop from the previous year.
“Every year, the profession turns to NCARB by the Numbers for comprehensive and insightful data on the path to licensure,” said NCARB President Gregory L. Erny, FAIA, NCARB. “As our data analytic capabilities expand, we are now able to shine a light on intriguing, and sometimes controversial, topics—including improving diversity among practitioners and shortening the timeline to licensure.”
The findings are pulled from the nonprofit’s database of over 111,000 NCARB-certified architects and licensure candidates, making NCARB by the Numbers the most comprehensive source for licensure statistics.
To read the full report, explore interactive data charts, and download infographics, visit www.ncarb.org/NBTN2017.
Related Stories

Market Data | Dec 11, 2017
Global hotel construction pipeline is growing
The Total Pipeline stands at 12,427 Projects/2,084,940 Rooms.
Market Data | Dec 11, 2017
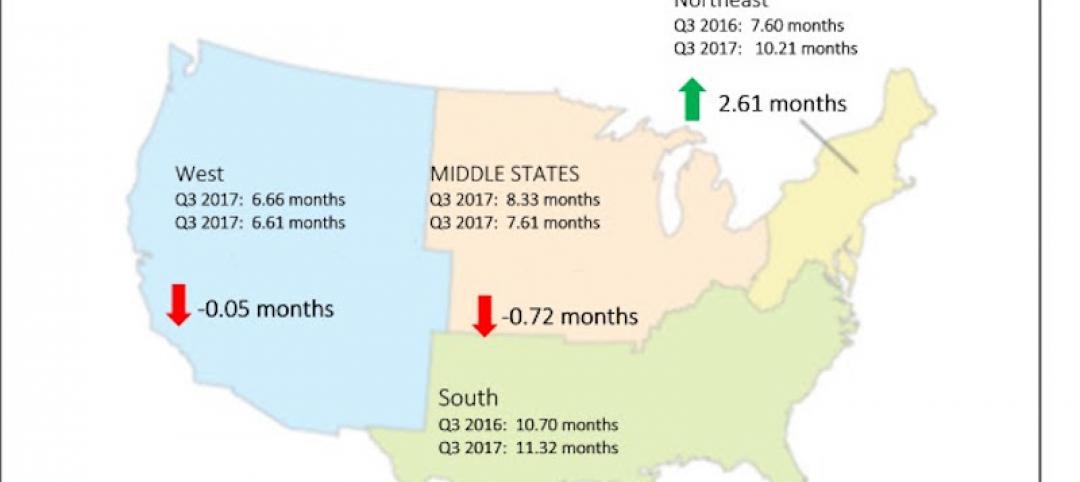
Construction backlog surges, sets record in third quarter
CBI is a leading economic indicator that reflects the amount of construction work under contract, but not yet completed.
Market Data | Dec 7, 2017
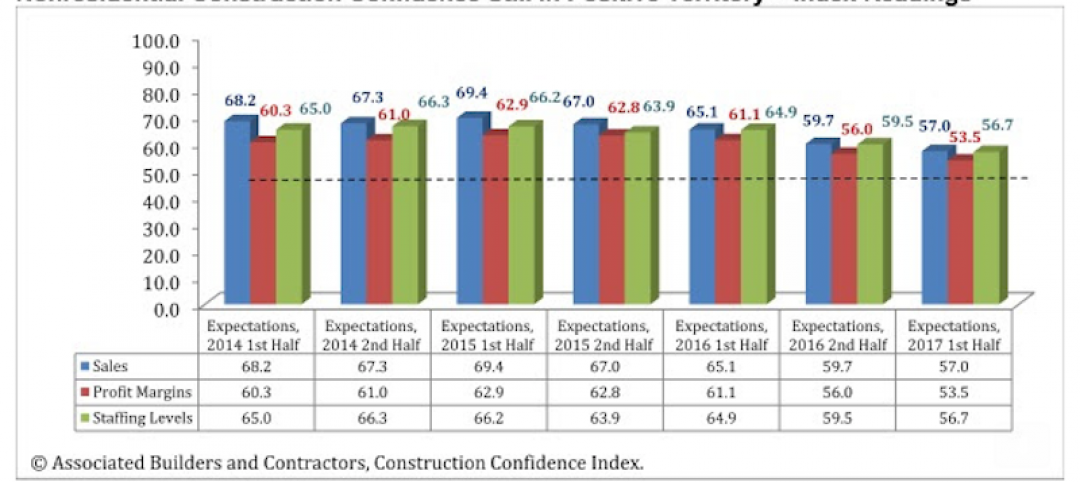
Buoyed by healthy economy, ABC Index finds contractors upbeat
Despite rising construction labor and materials costs, 55% of contractors expect their profit margins to expand in the first half of 2018.

Industry Research | Nov 28, 2017
2018 outlook: Economists point to slowdown, AEC professionals say ‘no way’
Multifamily housing and senior living developments head the list of the hottest sectors heading into 2018, according a survey of 356 AEC professionals.

Architects | Nov 28, 2017
Adding value through integrated technology requires a human touch
To help strike that delicate balance between the human and the high-tech, we must first have an in-depth understanding of our client’s needs as well as a manufacturer’s capabilities.
Market Data | Nov 27, 2017
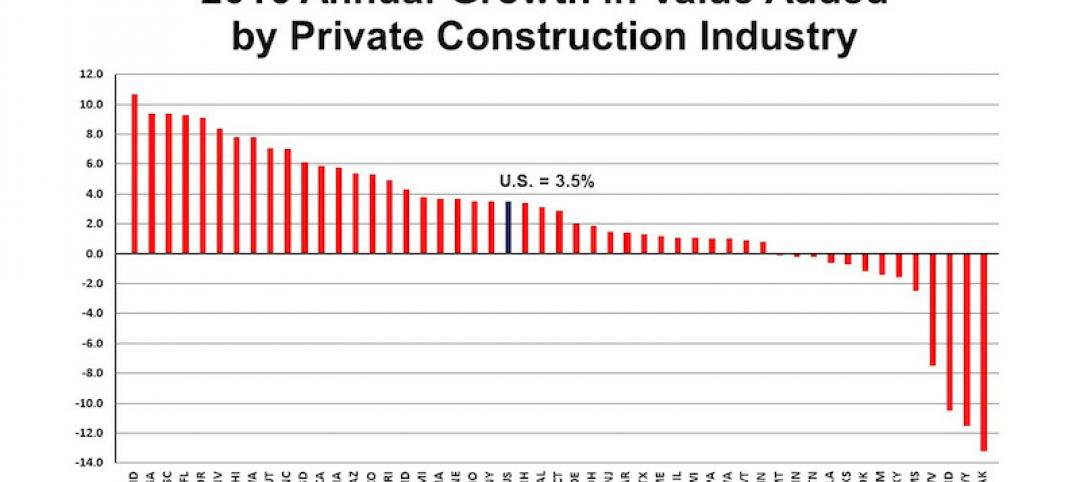
Construction's contribution to U.S. economy highest in seven years
Thirty-seven states benefited from the rise in construction activity in their state, while 13 states experienced a reduction in activity.
Market Data | Nov 15, 2017
Architecture Billings bounce back
Business conditions remain uneven across regions.
Market Data | Nov 14, 2017
U.S. construction starts had three consecutive quarters of positive growth in 2017
ConstructConnect’s quarterly report shows the most significant annual growth in the civil engineering and residential sectors.

Market Data | Nov 3, 2017
New construction starts in 2018 to increase 3% to $765 billion: Dodge report
Dodge Outlook Report predicts deceleration but still growth, reflecting a mixed pattern by project type.
Market Data | Nov 2, 2017
Construction spending up in September; Down on a YOY basis
Nonresidential construction spending is down 2.9% on a year-over-year basis.


