


Transwestern’s latest national office report reflects resilience in market fundamentals, even in the face of the moderating pace of U.S. economic growth demonstrated by net job creation averaging 172,000 per month for the first half of the year. In this environment, the national vacancy rate held steady at 9.7% in the second quarter thanks to healthy preleasing levels of newly delivered office assets.
“Signals continue to point to a disciplined office market that will perform well through year-end,” said Elizabeth Norton, Managing Director of Research at Transwestern. “Especially noteworthy is that in the second quarter, annual asking rental rates grew 4.2% year over year, the fastest rate this cycle and well above the five-year average of 3.4%.”
At quarter end, the average asking rental rate was $26.83 per square foot. Annual rent growth has been strongest in Tampa, Florida (10.6%), followed by Nashville, Tennessee (9.5%); San Jose/Silicon Valley, California (9.4%); Austin, Texas (8.8%); and San Francisco (8.8%).
Additionally, net absorption more than doubled to 24 million square feet in the second quarter despite sublet space adding 1.9 million square feet back to available inventory. Absorption leaders during the past year include Seattle; Charlotte, North Carolina; Dallas-Fort Worth; Los Angeles; and Northern Virginia. Seattle posted nearly 6 million square feet of absorption during the past 12 months, bringing the metro’s vacancy rate down to 6.1%, the fourth-lowest of the 49 markets tracked by Transwestern.
Office construction activity hit its highest level of this cycle, growing 9.6% during the prior 12 months. The second quarter saw more than 21.7 million square feet of new space added to inventory, and this pace will continue through the remainder of the year. Currently, 163.6 million square feet is in the pipeline nationally.
Download the full Second Quarter 2019 U.S. Office Market Report at: http://twurls.com/us-office-
Related Stories
Market Data | Nov 2, 2018
Nonresidential spending retains momentum in September, up 8.9% year over year
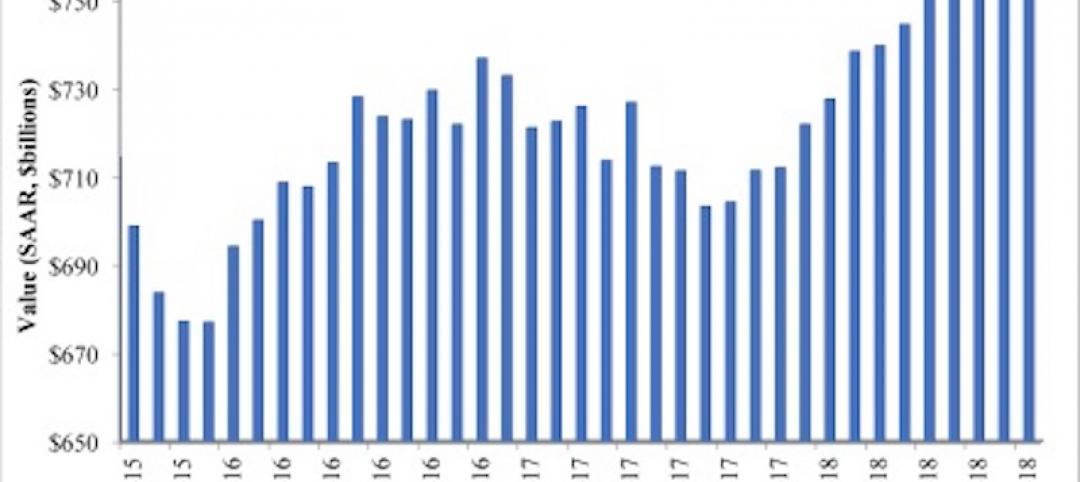
Total nonresidential spending stood at $767.1 billion on a seasonally adjusted, annualized rate in September.

Market Data | Oct 30, 2018
Construction projects planned and ongoing by world’s megacities valued at $4.2trn
The report states that Dubai tops the list with total project values amounting to US$374.2bn.
Market Data | Oct 26, 2018
Nonresidential fixed investment returns to earth in Q3
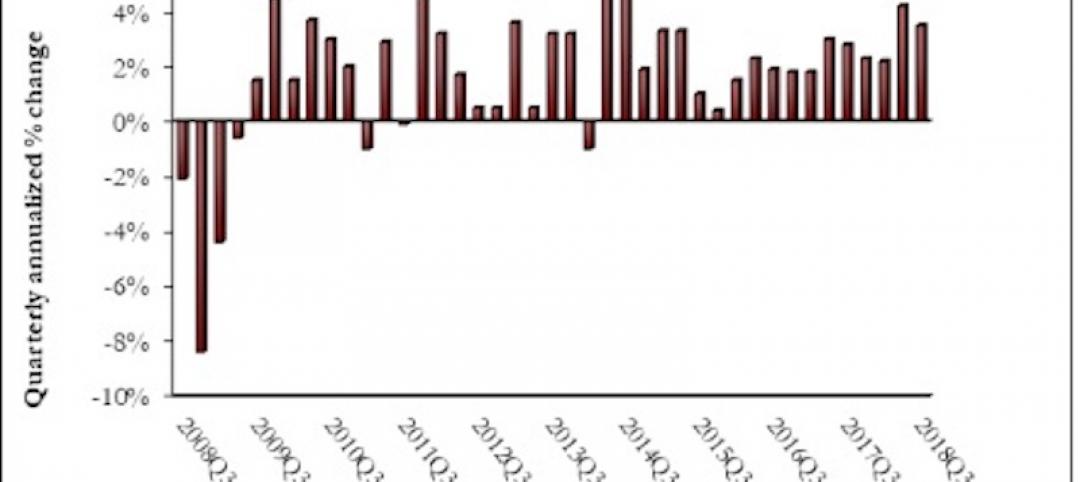
Despite the broader economic growth, fixed investment inched 0.3% lower in the third quarter.

Market Data | Oct 24, 2018
Architecture firm billings slow but remain positive in September
Billings growth slows but is stable across sectors.

Market Data | Oct 19, 2018
New York’s five-year construction spending boom could be slowing over the next two years
Nonresidential building could still add more than 90 million sf through 2020.

Market Data | Oct 8, 2018
Global construction set to rise to US$12.9 trillion by 2022, driven by Asia Pacific, Africa and the Middle East
The pace of global construction growth is set to improve slightly to 3.7% between 2019 and 2020.

Market Data | Sep 25, 2018
Contractors remain upbeat in Q2, according to ABC’s latest Construction Confidence Index
More than three in four construction firms expect that sales will continue to rise over the next six months, while three in five expect higher profit margins.

Market Data | Sep 24, 2018
Hotel construction pipeline reaches record highs
There are 5,988 projects/1,133,017 rooms currently under construction worldwide.
Market Data | Sep 21, 2018
JLL fit out report portrays a hot but tenant-favorable office market
This year’s analysis draws from 2,800 projects.
Market Data | Sep 21, 2018
Mid-year forecast: No end in sight for growth cycle
The AIA Consensus Construction Forecast is projecting 4.7% growth in nonresidential construction spending in 2018.


