


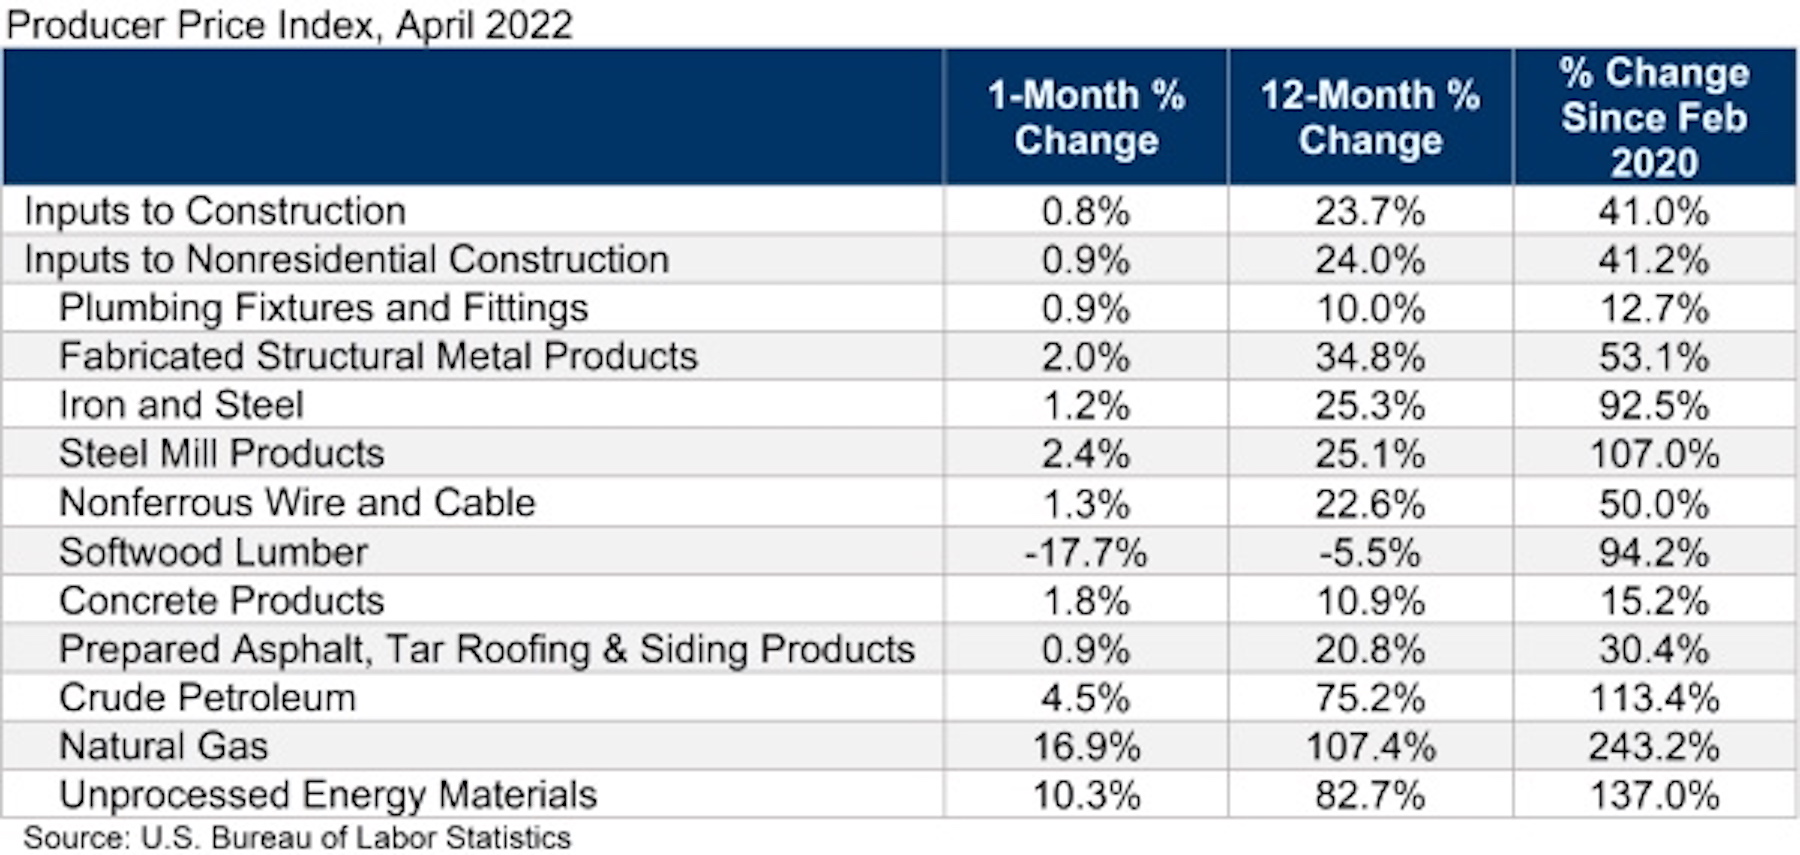
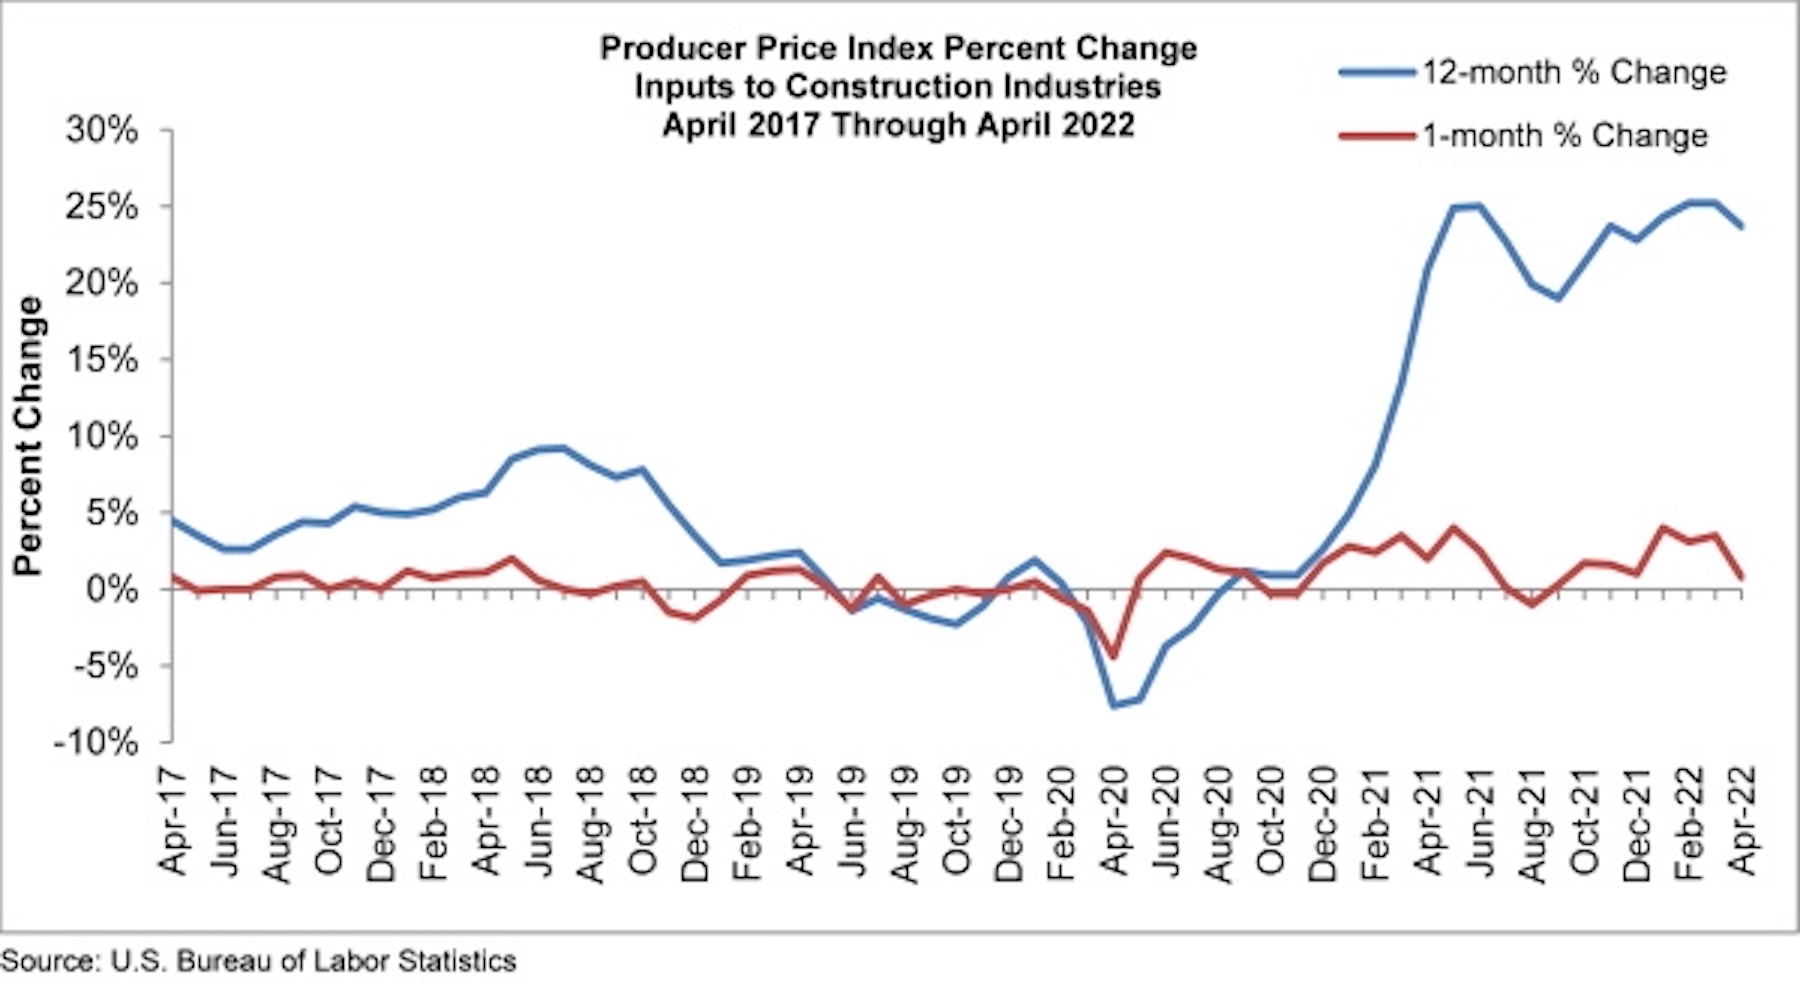
Construction input prices increased 0.8% in April compared to the previous month, according to an Associated Builders and Contractors analysis of U.S. Bureau of Labor Statistics’ Producer Price Index data released today. Nonresidential construction input prices rose 0.9% for the month.
Construction input prices are up 23.7% from a year ago, while nonresidential construction input prices are 24.0% higher. Input prices were up in 10 of 11 subcategories in April. Softwood lumber was the only category in which prices decreased, falling 17.7% for the month. The largest price increases were in natural gas (+16.9%) and unprocessed energy materials (+10.3%).
“There are some economists who believe that inflation has peaked,” said ABC Chief Economist Anirban Basu. “Even if that were true, stakeholders should not expect dramatic declines in inflation in the near term given an array of factors placing upward pressure on prices: the Russia-Ukraine war, COVID-19, a shrunken labor force, elevated transportation costs and abundant demand for goods. Today’s PPI release indicates that producers continue to ask for and receive elevated prices for their limited production. These high input prices will continue to circulate through the economy as production continues, whether in the form of manufactured goods, buildings or infrastructure.
“According to ABC’s Construction Confidence Index, many contractors report that demand for their services remains sufficiently robust for them to pass along the bulk of their cost increases to project owners,” said Basu. “But at some point, the economy could weaken to the point that purchasers of construction services become less willing to pay elevated prices.
“The Federal Reserve is now in the middle of what will likely prove a lengthy monetary tightening process, and higher borrowing costs are rendering project starts less likely, all things being equal. That said, certain segments are likely to power through this dynamic, should it happen. That includes public construction, given the recent passage and ongoing implementation of a large-scale American infrastructure package. It should be noted that recent inflation has reduced the return taxpayers will get per dollar spent on infrastructure.”
Related Stories
Market Data | Nov 2, 2018
Nonresidential spending retains momentum in September, up 8.9% year over year
Total nonresidential spending stood at $767.1 billion on a seasonally adjusted, annualized rate in September.

Market Data | Oct 30, 2018
Construction projects planned and ongoing by world’s megacities valued at $4.2trn
The report states that Dubai tops the list with total project values amounting to US$374.2bn.
Market Data | Oct 26, 2018
Nonresidential fixed investment returns to earth in Q3
Despite the broader economic growth, fixed investment inched 0.3% lower in the third quarter.
Market Data | Oct 24, 2018
Architecture firm billings slow but remain positive in September
Billings growth slows but is stable across sectors.

Market Data | Oct 19, 2018
New York’s five-year construction spending boom could be slowing over the next two years
Nonresidential building could still add more than 90 million sf through 2020.

Market Data | Oct 8, 2018
Global construction set to rise to US$12.9 trillion by 2022, driven by Asia Pacific, Africa and the Middle East
The pace of global construction growth is set to improve slightly to 3.7% between 2019 and 2020.
Market Data | Sep 25, 2018
Contractors remain upbeat in Q2, according to ABC’s latest Construction Confidence Index
More than three in four construction firms expect that sales will continue to rise over the next six months, while three in five expect higher profit margins.

Market Data | Sep 24, 2018
Hotel construction pipeline reaches record highs
There are 5,988 projects/1,133,017 rooms currently under construction worldwide.
Market Data | Sep 21, 2018
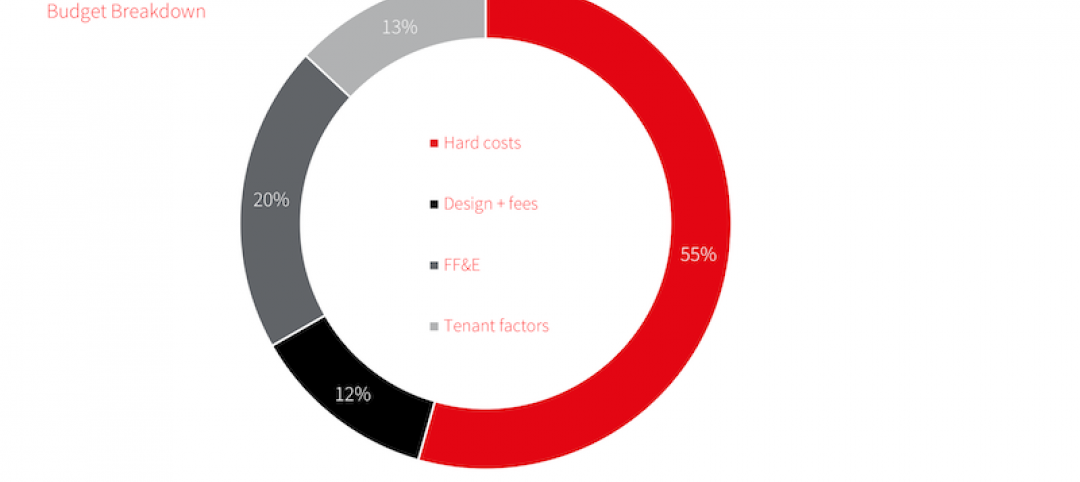
JLL fit out report portrays a hot but tenant-favorable office market
This year’s analysis draws from 2,800 projects.
Market Data | Sep 21, 2018
Mid-year forecast: No end in sight for growth cycle
The AIA Consensus Construction Forecast is projecting 4.7% growth in nonresidential construction spending in 2018.


