

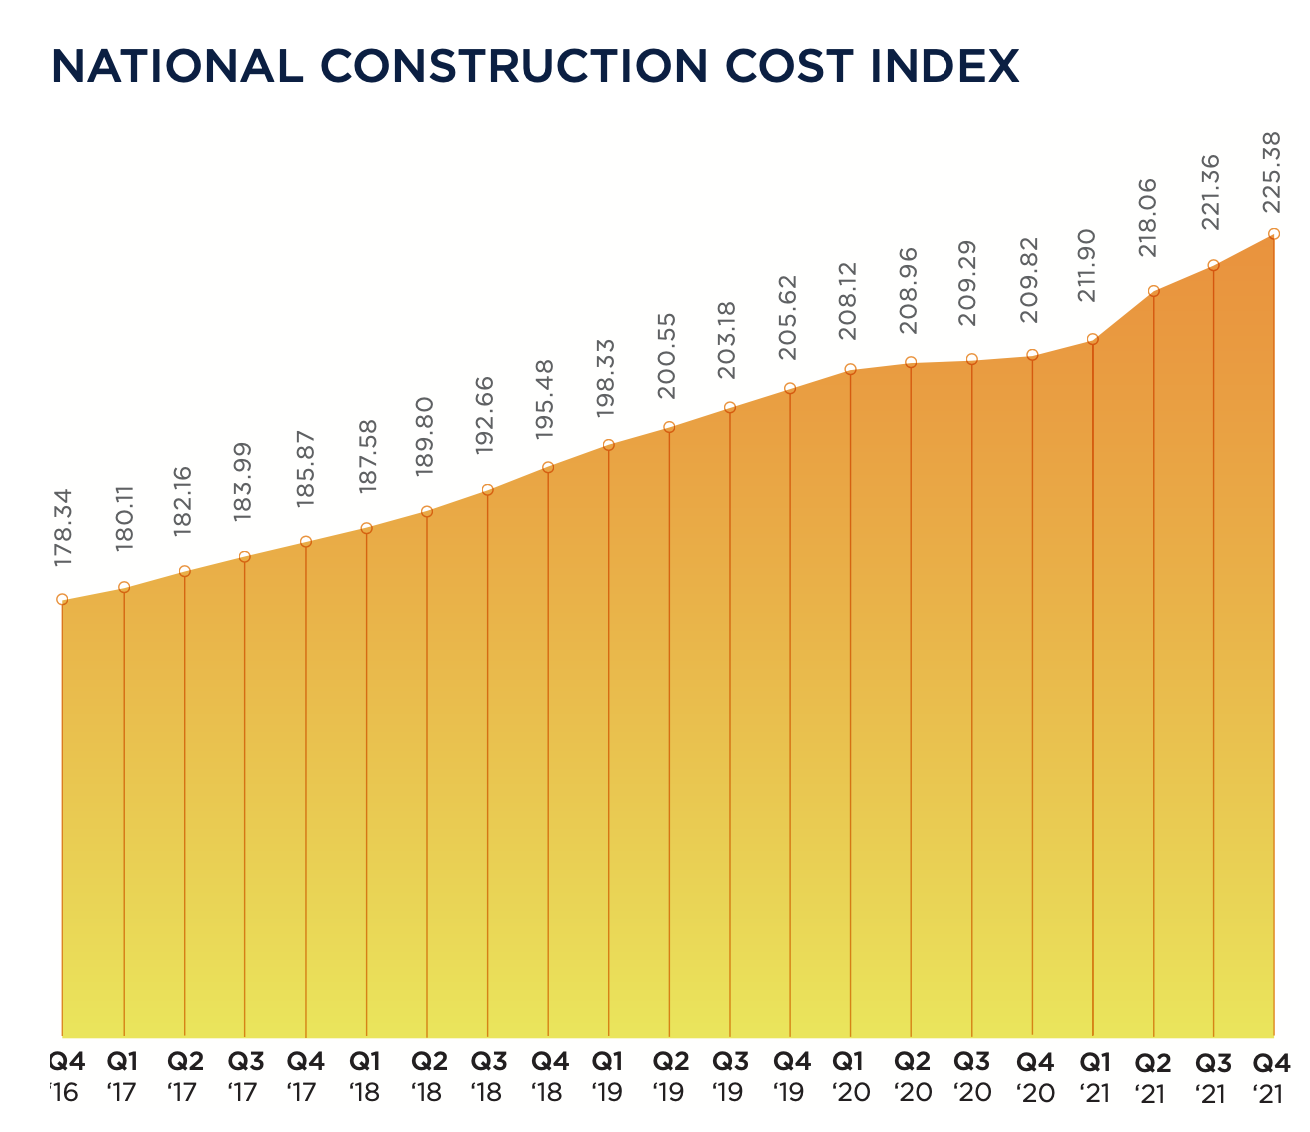
In the 12 months ended December 2021, bid construction costs rose 7.42 percent. “These increases are reminiscent of the sort of cost increases that we saw in the period 2004 to 2007,” wrote Julian Anderson, FRICS, President-North America for the construction advisory firm Rider Levett Bucknall (RLB), which today released its Fourth Quarter 2021 North America Construction Cost Report.
RLB’s National Construction Cost Index for the fourth quarter stood at 225.38, 7.4 percent higher than the Index for the fourth quarter of 2020, and 1.8 percent higher than last year’s third quarter. In his essay for this report, Anderson was optimistic about the eventual positive impact of the recently passed Bipartisan Infrastructure bill on construction and repair.
However, the force of that legislation could be stymied, or at least delayed, by supply chain problems that continue to plague the industry. Bottlenecks at western ports and chronic shortages of skilled labor still contribute to this volatility. Cost increases are also a function of rising inflation, as the Consumer Price Index registered a year-over-year increase of 5.38 percent.
On the positive side, America’s Gross Domestic Product, which measures output, returned to 2.1 percent, which was about where it was in the pre-pandemic fourth quarter of 2019. And the rate of unemployment for the construction sector dipped to 4.5 percent in Q421, versus 9.6 percent in Q420. Construction tracked national unemployment that has also been on a downward trend.
SEVERAL METROS BUCKED QUARTERLY COST TREND
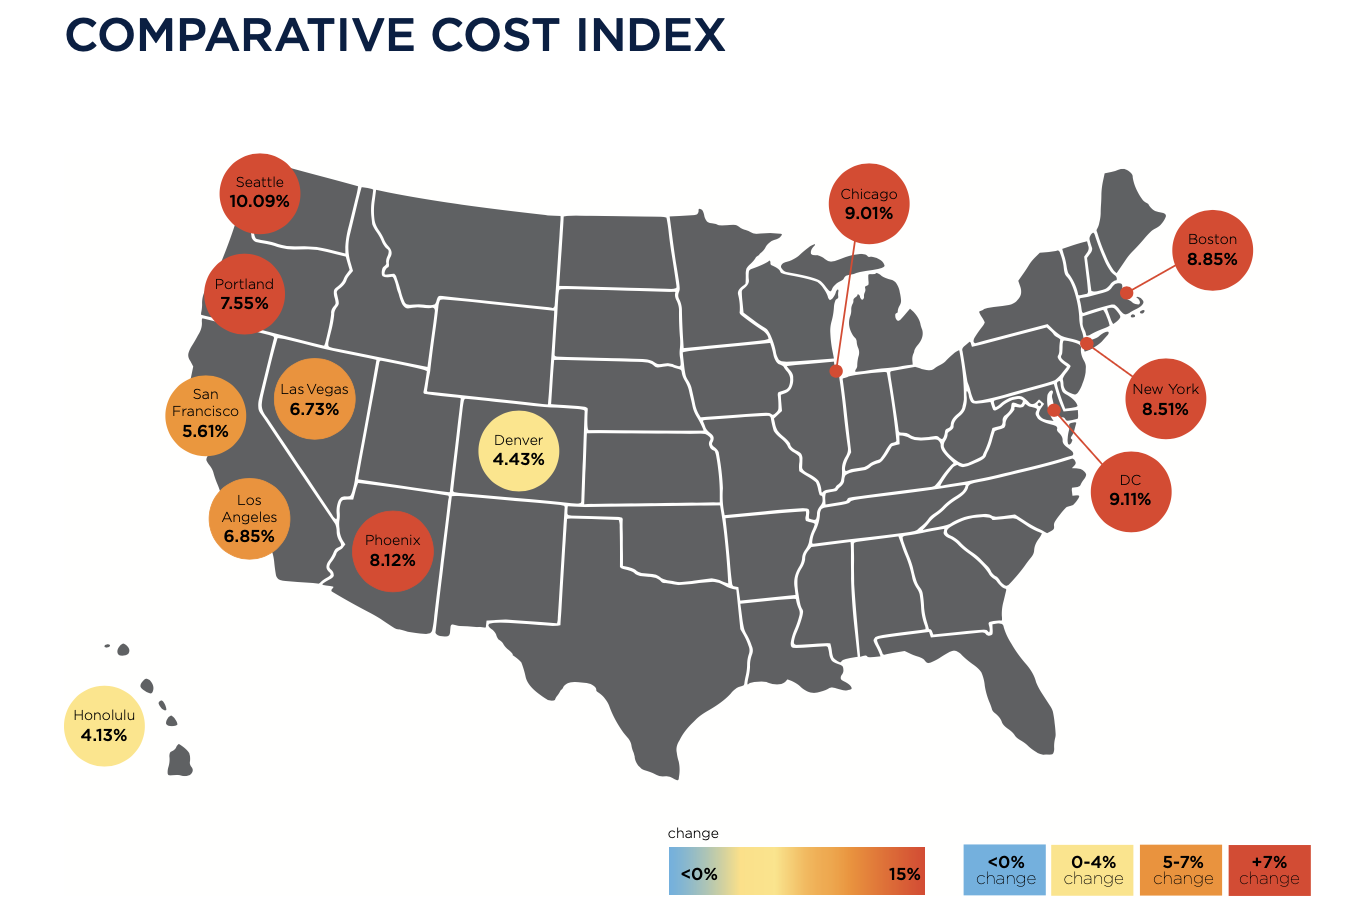
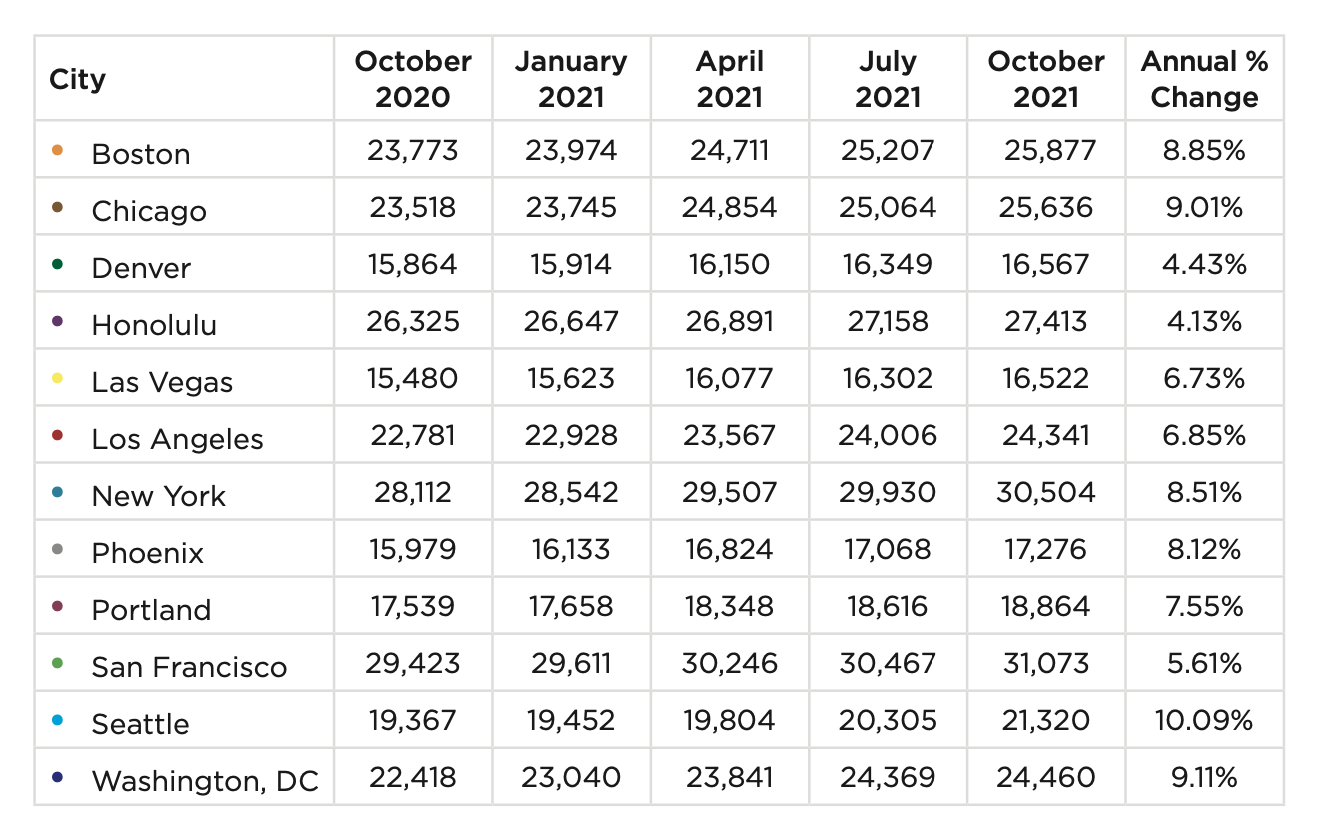
Nonresidential construction spending in November 2021, the latest month for which data were available from the Census Bureau, stood at $820.6 billion, 3.4 percent higher than the same month in 2021. But materials and labor keep getting more expensive, too. RLB’s Comparative Cost Index found that, from October 2020 through October 2021, construction costs rose by 10.09 percent in Seattle, by 9.11 percent in Washington DC, by 9.01 percent in Chicago, by 8.85 percent in Boston, and by 8.51 percent in New York.
Indexed by building type, construction costs were among the highest in New York for offices, shopping malls, hospitals, single-family homes, and high schools. San Francisco’s construction costs exceeded the other markets RLB tracked for five-star hotels, hospitals, warehouses, parking structures, multifamily homes, high schools, and universities.
Honolulu is the most expensive market in which to build elementary schools. But that market, along with Denver, Las Vegas, Los Angeles, Phoenix, Portland, and Washington DC, experienced overall cost increases between July 1 and October 1 that were less than the national average for that period, according to RLB estimates.
Related Stories

Industry Research | Aug 11, 2017
NCARB releases latest data on architectural education, licensure, and diversity
On average, becoming an architect takes 12.5 years—from the time a student enrolls in school to the moment they receive a license.

Market Data | Aug 4, 2017
U.S. grand total construction starts growth projection revised slightly downward
ConstructConnect’s quarterly report shows courthouses and sports stadiums to end 2017 with a flourish.

Market Data | Aug 2, 2017
Nonresidential Construction Spending falls in June, driven by public sector
June’s weak construction spending report can be largely attributed to the public sector.

Market Data | Jul 31, 2017
U.S. economic growth accelerates in second quarter; Nonresidential fixed investment maintains momentum
Nonresidential fixed investment, a category of GDP embodying nonresidential construction activity, expanded at a 5.2% seasonally adjusted annual rate.

Multifamily Housing | Jul 27, 2017
Apartment market index: Business conditions soften, but still solid
Despite some softness at the high end of the apartment market, demand for apartments will continue to be substantial for years to come, according to the National Multifamily Housing Council.

Market Data | Jul 25, 2017
What's your employer value proposition?
Hiring and retaining talent is one of the top challenges faced by most professional services firms.

Market Data | Jul 25, 2017
Moderating economic growth triggers construction forecast downgrade for 2017 and 2018
Prospects for the construction industry have weakened with developments over the first half of the year.

Industry Research | Jul 6, 2017
The four types of strategic real estate amenities
From swimming pools to pirate ships, amenities (even crazy ones) aren’t just perks, but assets to enhance performance.
Market Data | Jun 29, 2017
Silicon Valley, Long Island among the priciest places for office fitouts
Coming out on top as the most expensive market to build out an office is Silicon Valley, Calif., with an out-of-pocket cost of $199.22.

Market Data | Jun 26, 2017
Construction disputes were slightly less contentious last year
But poorly written and administered contracts are still problems, says latest Arcadis report.


