


Lodging Econometrics (LE) has released its year-end Global Construction Pipeline Trend Report, which compiles the construction pipeline counts for every country and market around the world. At the close of 2018, LE analysts state that the total global construction pipeline hit record highs with 13,573 projects/2,265,792 rooms, a 7% increase in projects and a 6% increase in rooms year-over-year (YOY).
The global pipeline has been ascending for eight consecutive years after reaching its cyclical low in 2010. All regional pipelines, with the exception of South America, continued their upward trend YOY. It is notable considering economic growth rates started to decline in 2018 and are forecast to slow further in 2019 and 2020. Four of the seven global regions reached all-time highs in 2018: Europe, Africa, Middle East, and Asia Pacific.
There are a record high 6,352 projects/1,172,591 rooms currently under construction worldwide. Projects scheduled to start construction in the next 12 months are at 3,860 projects/572,483 rooms. Projects in the early planning stage stand at 3,361rooms/520,718 projects, also at an all-time high.
The top countries by project count are the United States with 5,530 projects/669,456 rooms, still short of its all-time high of 5,883 projects/785,547 rooms set in the second quarter of 2008, and China with 2,761 projects/580,635 rooms whose pipeline reached a new all-time high. The U.S. accounts for 41% of projects in the total global construction pipeline while China accounts for 20%, resulting in 61% of all global projects being focused in just these two countries. Distantly following are Indonesia with 387 projects/65,405 rooms, Germany with 283 projects/52,569 rooms, and the United Kingdom with 266 projects/38,590 rooms.
Around the world, the cities with the largest pipeline counts are New York City with 171 projects/29,457 rooms, Dubai with 168 projects/49,943 rooms, and Dallas with 163 projects/19,476 rooms. Los Angeles follows with 147 projects/23,404 rooms, and Guangzhou, China with 132 projects/28,694 rooms.
The leading franchise companies in the global construction pipeline by project count are Marriott International with 2,544 projects/420,405 rooms, Hilton Worldwide with 2,252 projects/333,209 rooms, InterContinental Hotels Group (IHG) with 1,716 projects/249,379 rooms, and AccorHotels with 966 projects/177,052 rooms. These four companies account for 55% of all projects in the global pipeline.
Brands leading in the pipeline for each of these companies are Marriott’s Fairfield Inn with 397 projects/43,089 rooms, Hampton by Hilton with 619 projects/79,591 rooms, IHG’s Holiday Inn Express with 731 projects/91,691 rooms, and AccorHotel’s Ibis Brands with 321 projects/48,368 rooms.
Related Stories

Market Data | Jun 14, 2016
Transwestern: Market fundamentals and global stimulus driving economic growth
A new report from commercial real estate firm Transwestern indicates steady progress for the U.S. economy. Consistent job gains, wage growth, and consumer spending have offset declining corporate profits, and global stimulus plans appear to be effective.

Market Data | Jun 7, 2016
Global construction disputes took longer to resolve in 2015
The good news: the length and value of disputes in the U.S. fell last year, according to latest Arcadis report.

Market Data | Jun 3, 2016
JLL report: Retail renovation drives construction growth in 2016
Retail construction projects were up nearly 25% year-over-year, and the industrial and office construction sectors fared well, too. Economic uncertainty looms over everything, however.

Market Data | Jun 2, 2016
ABC: Nonresidential construction spending down in April
Lower building material prices, a sluggish U.S. economy, and hesitation among private developers all factor into the 2.1% drop.

Market Data | May 20, 2016
Report: Urban area population growth slows
Older Millennials are looking to buy homes and move away to more affordable suburbs and exurbs.
Market Data | May 17, 2016
Modest growth for AIA’s Architecture Billings Index in April
The American Institute of Architects reported the April ABI score was 50.6, down from the mark of 51.9 in the previous month. This score still reflects an increase in design services.

Market Data | Apr 29, 2016
ABC: Quarterly GDP growth slowest in two years
Bureau of Economic Analysis data indicates that the U.S. output is barely growing and that nonresidential investment is down.

Market Data | Apr 20, 2016
AIA: Architecture Billings Index ends first quarter on upswing
The multi-family residential sector fared the best. The Midwest was the only U.S. region that didn't see an increase in billings.
Building Technology | Apr 11, 2016
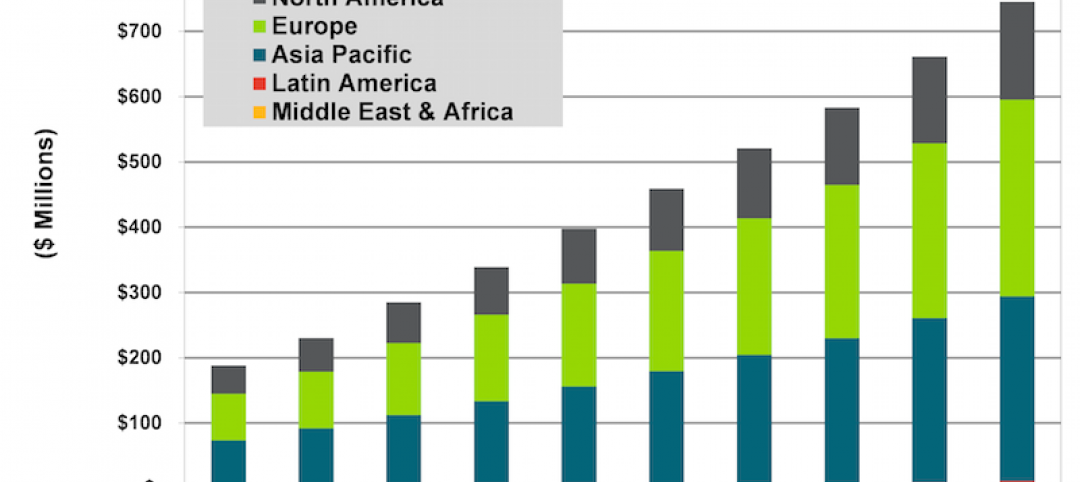
A nascent commercial wireless sensor market is poised to ascend in the next decade
Europe and Asia will propel that growth, according to a new report from Navigant.
Industry Research | Apr 7, 2016
CBRE provides latest insight into healthcare real estate investors’ strategies
Survey respondents are targeting smaller acquisitions, at a time when market cap rates are narrowing for different product types.


