


A new report on office fit-out costs in North America sets out to establish a range of benchmarks for three different office styles, and to suggest what businesses favor which style.
JLL’s project and development services group, which produced the report, used data from more than 2,800 JLL-managed project budgets for over 100 clients from 17 industries in 59 markets throughout the U.S. and Canada.
The goal, says JLL, is to “elevate the conversation” around the real costs of building out various real estate designs. This year’s report includes office layout and space quality components to allow for evaluations of different office layouts, project complexities, and materials. It also provides high, medium, and low allowances for furniture, fixtures, and equipment (FFE); as well as for the installation of audio-visual and security equipment.
The result is an Office Fit Out Matrix, which shows how a handful of dynamics affect fit-out costs. Depending on the market and style, the costs range from $120.18 per sf to $216.07 per sf (see chart).
JLL breaks down these costs by region and metro market. The Northeast and Northwest consistently have higher fit-out costs. The medium costs in New York City are 28.5% above the U.S. average. In San Francisco, a fit-out would cost 22.6% more than the U.S. average. Conversely, the medium fit-out costs in West Palm Beach, Fla., are 15.9% below the national average; in Austin, Texas, 15.3% below.
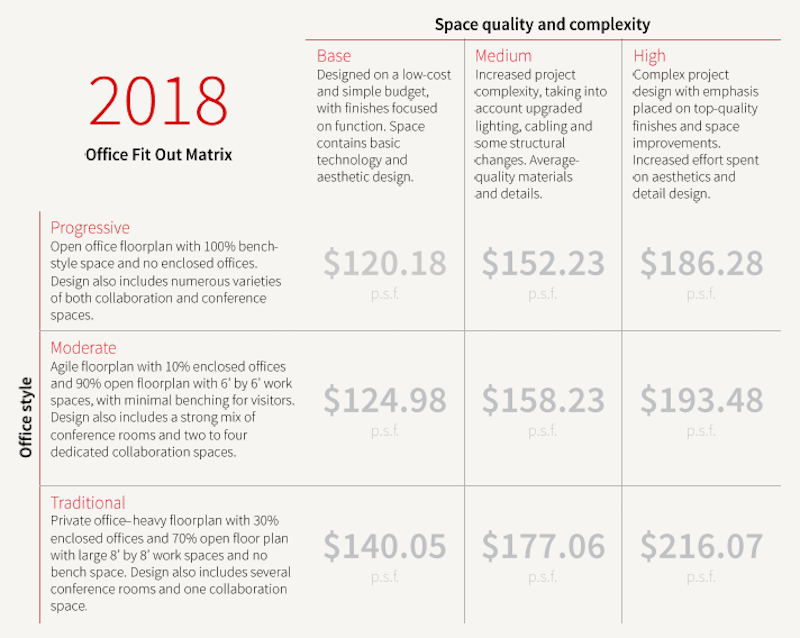
This office fit-out matrix is based on data from over 2,800 project budgets in North America that JLL managed. Image: JLL
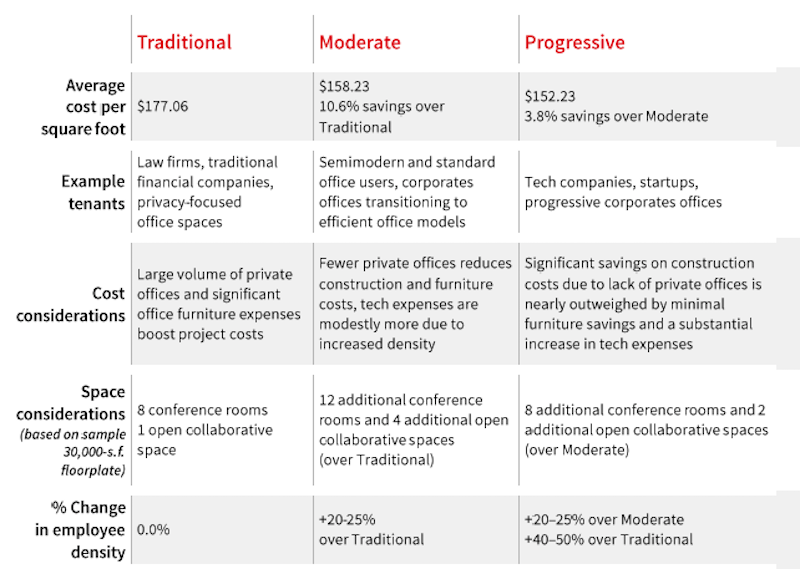
JLL's matrix compares the medium costs for fitting out three different office styles. Image: JLL
Three office styles examined
JLL divides its office fit-out costs along three styles:
• A Traditional office is still the most expensive to fit out. This style has the highest percentage of private office spaces, and typically between 20% and 50% fewer employees than the other two styles. Its FFE costs are the highest among the three styles, too. And tenant factors are “relatively small,” says JLL, because there is less common area. These offices are still favored by law firms, financial services companies, and businesses that focus on privacy with their offices.
JLL observes that some Traditional office styles are introducing lower-partition bench desks.
• A less-expensive fit-out, a Moderate office style features “agile” floorplans, with 10% dedicated to enclosed offices, and the rest of the space open with 6x6-foot workstations and minimal benching and guest space. Moderate offices—which are 20-25% less dense than Progressive office styles—include a healthy mix of conference rooms, and a few multipurpose and collaborative spaces. The hard fit-out costs for the Moderate style are average, but cost efficiencies can be captured by adding more bench-style desks.
• The Progressive office style is distinguished by an open floorplan, 100% of its desk space outfitted as bench-style furniture with zero enclosed spaces. This style’s focus is on activity-based working. Its employee density is 20-50% higher than a Traditional office, and it has double the amount of collaborative and conference spaces. (A standard plan would include 20 conference rooms and seven open collaborative/multi-use spaces.)
JLL points out that Progressive fit-outs generally have higher technology costs, but save money on FFE spending.
Landlords allowing for more upgrades
Last year, nearly 69 million sf of new office space were delivered to the market, but only 47.4% was preleased. JLL’s report observes that landlords are spending more to compete for tenants that are consistently gravitating toward high-quality spaces and assets. Consequently, landlords are offering better tenant improvement packages.
JLL cites several reasons for this trend, including the steady climb in construction costs, which increased on average by 15% last year. Landlords also offer better tenant improvement packages to offset the impact of higher rents.
The national average for tenant improvement allowances was $44 per sf, ranging from $105/sf in Washington D.C. to $28/sf in Nashville.
The report provides detailed snapshots of several markets, such as Austin, one of the country’s dynamic office markets, with robust growth supply. There are 3.1 million sf of new office space in Austin’s pipeline, 36% of which is preleased. The average tenant improvement allowance there last year was $45/sf.
There’s 7 million sf of new office space in the pipeline in San Francisco, where the office vacancy rate is 9.1%, and 68.8% of new space is preleased. The average tenant improvement allowance in San Francisco last year was $60/sf.
Related Stories

| Oct 27, 2011
iProspect selects VLK Architects for new office design
Company growth prompted iProspect to make the decision to move to a new space.

| Oct 20, 2011
Johnson Controls appoints Wojciechowski to lead real estate and facilities management business for Global Technology sector
Wojciechowski will be responsible for leading the continued growth of the technology vertical market, while building on the expertise the company has developed serving multinational technology companies.
| Oct 18, 2011
Dow Building Solutions invests in two research facilities to deliver data to building and construction industry
State-of-the-art monitoring system allows researchers to collect, analyze and process the performance of wall systems.
| Oct 17, 2011
Big D Floor covering supplies to offer Johnsonite Products??
Strategic partnership expands offering to south and west coast customers.

| Oct 17, 2011
Schneider Electric introduces UL924 emergency lighting control devices
The emergency lighting control devices require fewer maintenance costs and testing requirements than backup batteries because they comply with the UL924 standard, reducing installation time.

| Oct 14, 2011
AISC develops new interoperability strategy to move construction industry forward
AISC is working to bring that vision to reality by developing a three-step interoperability strategy to evaluate data exchanges and integrate structural steel information into buildingSMART's Industry Foundation Classes.

| Oct 12, 2011
Vertical Transportation Systems Reach New Heights
Elevators and escalators have been re-engineered to help building owners reduce energy consumption and move people more efficiently.

| Oct 12, 2011
Building a Double Wall
An aged federal building gets wrapped in a new double wall glass skin.

Office Buildings | Oct 12, 2011
8 Must-know Trends in Office Fitouts
Office designs are adjusting to dramatic changes in employee work habits. Goodbye, cube farm. Hello, bright, open offices with plenty of collaborative space.

| Oct 12, 2011
FMI’s Construction Outlook: Third Quarter 2011 Report
Construction Market Forecast: The general economy is seeing mixed signs.


