

According to a report released today by Associated Builders and Contractors (ABC), the private construction industry’s value added as a percentage of the nation’s real gross domestic product (GDP) rose to 4 in 2016, the highest level since 2009. The report also shows annual growth in real construction spending, which rose 3.5% in 2016. Thirty-seven states benefited from the rise in construction activity in their state, while 13 states experienced a reduction in activity.
“Although the relative impact of the value added by private construction on various state economies varies both among states in a particular year and within a state over time, every state benefits from construction activity,” said Bernard M. Markstein, Ph.D., president and chief economist of Markstein Advisors, who conducted the analysis and prepared the report for ABC. “The increase in that activity in a particular year adds to the income and potential growth of each state. A decline in that activity acts as a drag on a state’s economic performance.”
The 3.5% national increase in real construction spending was a slowdown from the 4.9% increase in 2015. Only 18 states had a greater growth in real construction spending in 2016 compared to 2015.

2016 CONSTRUCTION SPENDING: THE TOP FIVE STATES
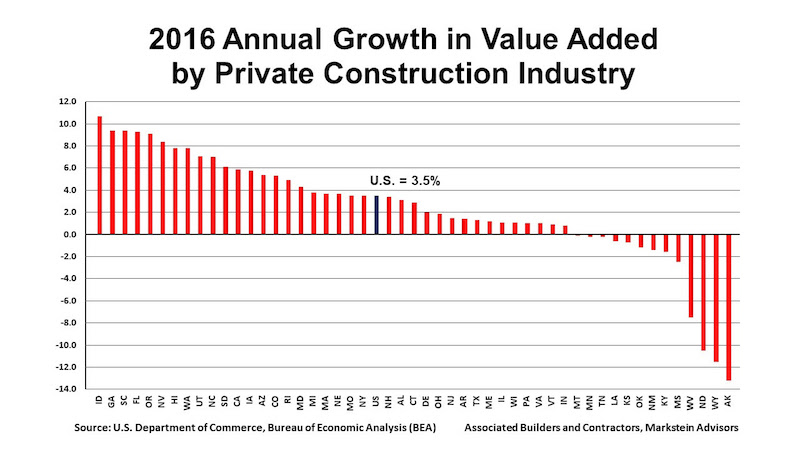
The fastest growth was in the West and the South. The first state outside of those two regions in the ranking of construction growth rates is Rhode Island with the 16th largest increase (up 4.9%). In 2016, the top five states for the increase in their real value added from construction in order from highest to lowest were:
1. Idaho, up 10.7%
2. Georgia and South Carolina (tie), up 9.4%
4. Florida, up 9.3%
5. Oregon, up 9.1%
Idaho had the highest percentage contribution from construction, even though state real GDP advanced a respectable, but more modest, 1.8%. Georgia slipped from its number-one ranking in 2015, while South Carolina made a significant jump from 17th to second place.
Florida’s ranking of number four is down from second place in 2015 when its real construction spending was 11.1%. Oregon saw a big improvement from 33rd place in 2015.
2016 CONSTRUCTION SPENDING: THE BOTTOM FIVE STATES
All of the bottom five states suffered from the effects of low energy prices.
46. Mississippi, down 2.5%
47. West Virginia, down 7.5%
48. North Dakota, down 10.5%
49. Wyoming, down 11.5%
50. Alaska, down 13.2%
Alaska has struggled over the last few years. Not only did it experience the largest drop in real private construction spending in 2016, but it also experienced the second largest decrease in state GDP in the nation, down 5%. Real private construction spending has been down every year starting in 2011, except for 2015 (up 0.2%).
Although Wyoming improved its 2016 ranking—it had the largest decrease in 2015 at 6.6%—the 11.5% plunge was an acceleration of a bad outcome. North Dakota had the third largest decline in its real private construction spending in 2016 and 2015, down 10.5% and 4.1%, respectively. However, the state’s growth in construction spending ranked in the top 10 from 2008 through 2014.
West Virginia had the fourth largest decline in its real private construction spending in 2016 and 2015, down 7.5% and 3.1%, respectively. Mississippi’s 2016 decrease represents a slowdown in the decline in construction from 2014 and 2015, when private construction activity fell 8.6% and 5.6%, respectively.
Read the full report here.
Related Stories

Market Data | Sep 5, 2023
Nonresidential construction spending increased 0.1% in July 2023
National nonresidential construction spending grew 0.1% in July, according to an Associated Builders and Contractors analysis of data published today by the U.S. Census Bureau. On a seasonally adjusted annualized basis, nonresidential spending totaled $1.08 trillion and is up 16.5% year over year.

Giants 400 | Aug 31, 2023
Top 35 Engineering Architecture Firms for 2023
Jacobs, AECOM, Alfa Tech, Burns & McDonnell, and Ramboll top the rankings of the nation's largest engineering architecture (EA) firms for nonresidential buildings and multifamily buildings work, as reported in Building Design+Construction's 2023 Giants 400 Report.

Giants 400 | Aug 22, 2023
Top 115 Architecture Engineering Firms for 2023
Stantec, HDR, Page, HOK, and Arcadis North America top the rankings of the nation's largest architecture engineering (AE) firms for nonresidential building and multifamily housing work, as reported in Building Design+Construction's 2023 Giants 400 Report.

Giants 400 | Aug 22, 2023
2023 Giants 400 Report: Ranking the nation's largest architecture, engineering, and construction firms
A record 552 AEC firms submitted data for BD+C's 2023 Giants 400 Report. The final report includes 137 rankings across 25 building sectors and specialty categories.

Giants 400 | Aug 22, 2023
Top 175 Architecture Firms for 2023
Gensler, HKS, Perkins&Will, Corgan, and Perkins Eastman top the rankings of the nation's largest architecture firms for nonresidential building and multifamily housing work, as reported in Building Design+Construction's 2023 Giants 400 Report.

Apartments | Aug 22, 2023
Key takeaways from RCLCO's 2023 apartment renter preferences study
Gregg Logan, Managing Director of real estate consulting firm RCLCO, reveals the highlights of RCLCO's new research study, “2023 Rental Consumer Preferences Report.” Logan speaks with BD+C's Robert Cassidy.

Market Data | Aug 18, 2023
Construction soldiers on, despite rising materials and labor costs
Quarterly analyses from Skanska, Mortenson, and Gordian show nonresidential building still subject to materials and labor volatility, and regional disparities.

Apartments | Aug 14, 2023
Yardi Matrix updates near-term multifamily supply forecast
The multifamily housing supply could increase by up to nearly 7% by the end of 2023, states the latest Multifamily Supply Forecast from Yardi Matrix.

Hotel Facilities | Aug 2, 2023
Top 5 markets for hotel construction
According to the United States Construction Pipeline Trend Report by Lodging Econometrics (LE) for Q2 2023, the five markets with the largest hotel construction pipelines are Dallas with a record-high 184 projects/21,501 rooms, Atlanta with 141 projects/17,993 rooms, Phoenix with 119 projects/16,107 rooms, Nashville with 116 projects/15,346 rooms, and Los Angeles with 112 projects/17,797 rooms.

Market Data | Aug 1, 2023
Nonresidential construction spending increases slightly in June
National nonresidential construction spending increased 0.1% in June, according to an Associated Builders and Contractors analysis of data published today by the U.S. Census Bureau. Spending is up 18% over the past 12 months. On a seasonally adjusted annualized basis, nonresidential spending totaled $1.07 trillion in June.


