


Construction employment in November remained below pre-pandemic levels in 35 states and the District of Columbia even though 31 states and D.C. added construction jobs from October to November, according to an analysis by the Associated General Contractors of America of government employment data released today. Association officials urged federal officials to swiftly renew a program to enable firms to keep workers on their payrolls while the pandemic is pushing back the start date for many projects.
“An increase in project cancellations and postponements is forcing nonresidential contractors to lay off workers as they complete projects started before the pandemic and firms exhaust their Paycheck Protection Program loans,” said Ken Simonson, the association’s chief economist. “Despite strong demand for single-family homebuilding and remodeling, overall industry employment is likely to shrink in more states in the absence of federal assistance.”
Seasonally adjusted construction employment in November was lower than in February—the last month before the pandemic forced many contractors to suspend work—in 37 states, Simonson noted. New York lost the most construction jobs over the nine-month period (-39,700 jobs or -9.7%), followed by Texas (-37,200 jobs, -4.7%). Vermont experienced the largest percentage loss (-24.5%, -3,600 jobs), followed by North Dakota (-13.9%, -4,100 jobs).
Only 15 states and the District of Columbia added construction jobs from February to November. Virginia added the most jobs and highest percentage (11,800 jobs, 5.8%), followed by Utah (5,800 jobs, 5.1%).
Construction employment decreased from October to November in 17 states, increased in 31 states and D.C., and was unchanged in Maine and Nebraska. California had the largest loss of construction jobs from October to November (-5,800 jobs or -0.7%), followed by New Jersey (-3,800 jobs, -2.5%) and Nevada (-3,700 jobs, -3.9%). Nevada had the largest percentage decline, followed by South Dakota (-3.8%, -1,000 jobs).
Texas added the most construction jobs over the month (7,500 jobs, 1.0%), followed by Pennsylvania (4,300 jobs, 1.7%). Delaware had the largest percentage gain for the month (3.8%, 800 jobs), followed by Utah (2.6%, 3,000 jobs).
Association officials urged members of Congress to promptly pass a renewal of the Paycheck Protection Program, which saved thousands of construction workers from layoffs earlier in the year. They added that the legislation should also make clear that Congress did not intend for firms to incur tax liability when using the loans as intended.
“While the pandemic is causing more and more construction to be canceled or postponed, it is imperative that Congress renew the loan program that will keep contractors from shutting their doors and workers from losing their jobs,” said Stephen E. Sandherr, the association’s chief executive officer. “In addition, it is vital that Congress stop the Treasury from playing ‘gotcha’ with firms that rightly expected their loans to be treated as nontaxable.”
View state employment February-November data and rankings; and October-November rankings.
Related Stories
High-rise Construction | Jan 23, 2017
Growth spurt: A record-breaking 128 buildings of 200 meters or taller were completed in 2016
This marks the third consecutive record-breaking year for building completions over 200 meters.

Market Data | Jan 18, 2017
Fraud and risk incidents on the rise for construction, engineering, and infrastructure businesses
Seven of the 10 executives in the sector surveyed in the report said their company fell victim to fraud in the past year.

Market Data | Jan 18, 2017
Architecture Billings Index ends year on positive note
Architecture firms close 2016 with the strongest performance of the year.

Market Data | Jan 12, 2017
73% of construction firms plan to expand their payrolls in 2017
However, many firms remain worried about the availability of qualified workers.

Market Data | Jan 9, 2017
Trump market impact prompts surge in optimism for U.S. engineering firm leaders
The boost in firm leader optimism extends across almost the entire engineering marketplace.
Market Data | Jan 5, 2017
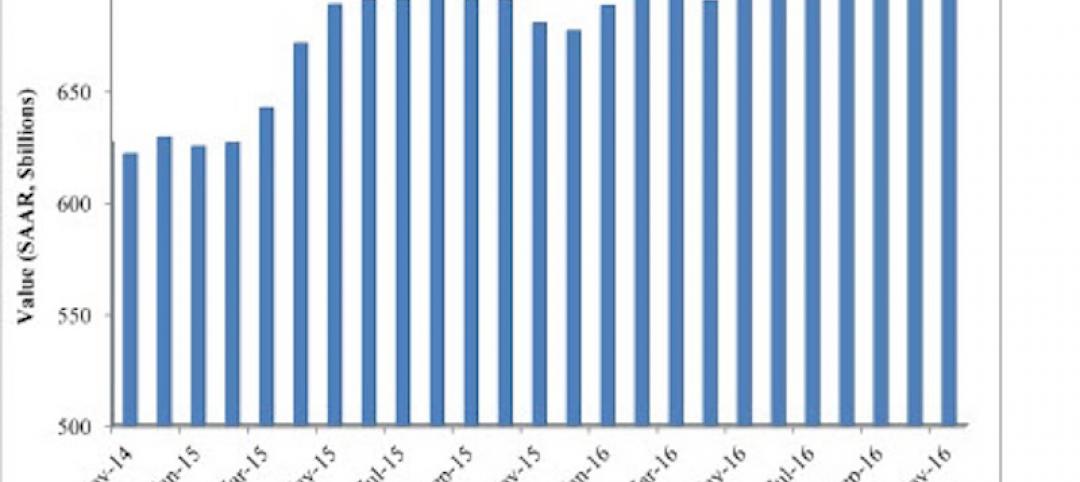
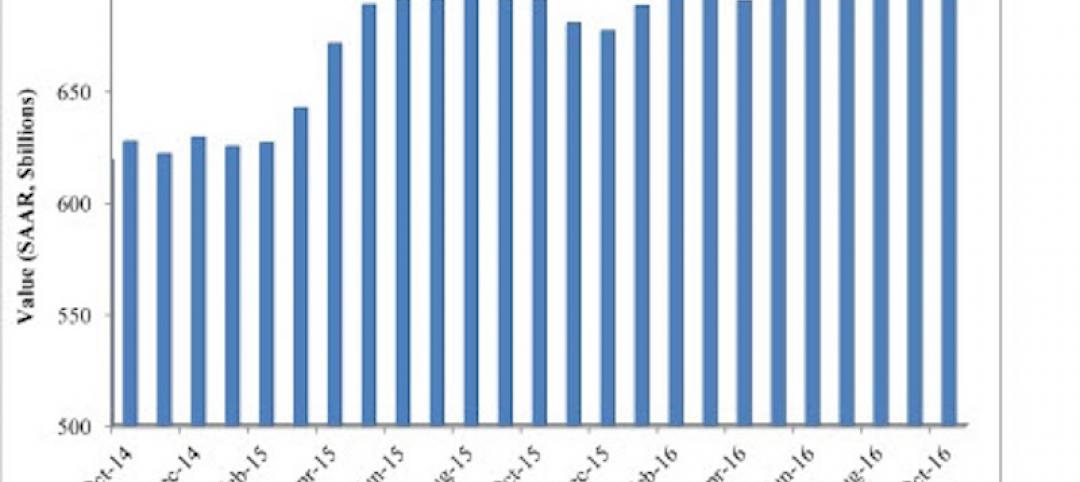
Nonresidential spending thrives in strong November spending report
Many construction firms have reported that they remain busy but have become concerned that work could dry up in certain markets in 2017 or 2018, says Anirban Basu, ABC Chief Economist.

Market Data | Dec 21, 2016
Architecture Billings Index up slightly in November
New design contracts also return to positive levels, signifying future growth in construction activity.
Market Data | Dec 21, 2016
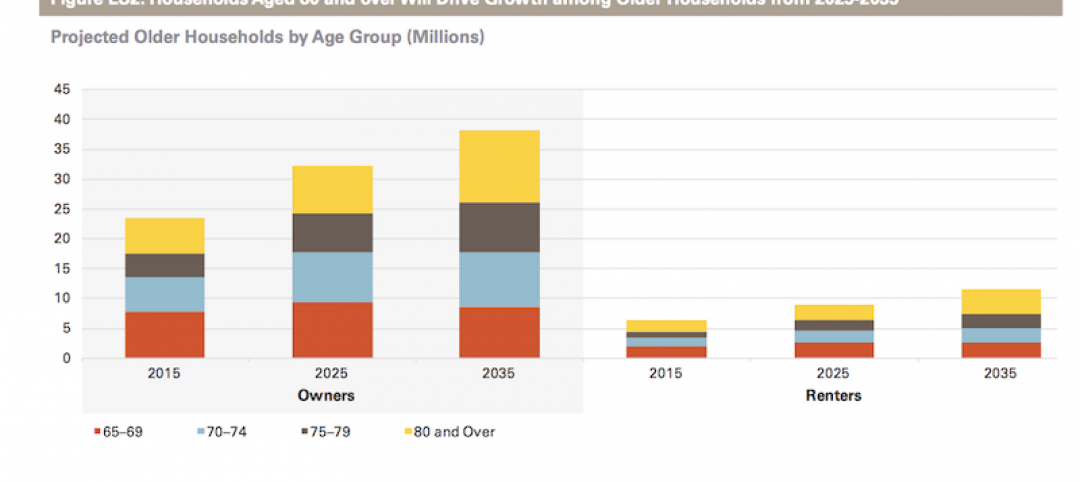
Will housing adjust to an aging population?
New Joint Center report projects 66% increase in senior heads of households by 2035.
Market Data | Dec 13, 2016
ABC predicts modest growth for 2017 nonresidential construction sector; warns of vulnerability for contractor
“The U.S. economy continues to expand amid a weak global economy and, despite risks to the construction industry, nonresidential spending should expand 3.5 percent in 2017,” says ABC Chief Economist Anirban Basu.
Market Data | Dec 2, 2016
Nonresidential construction spending gains momentum
Nonresidential spending is now 2.6 percent higher than at the same time one year ago.


